
Documentation

Quickstart

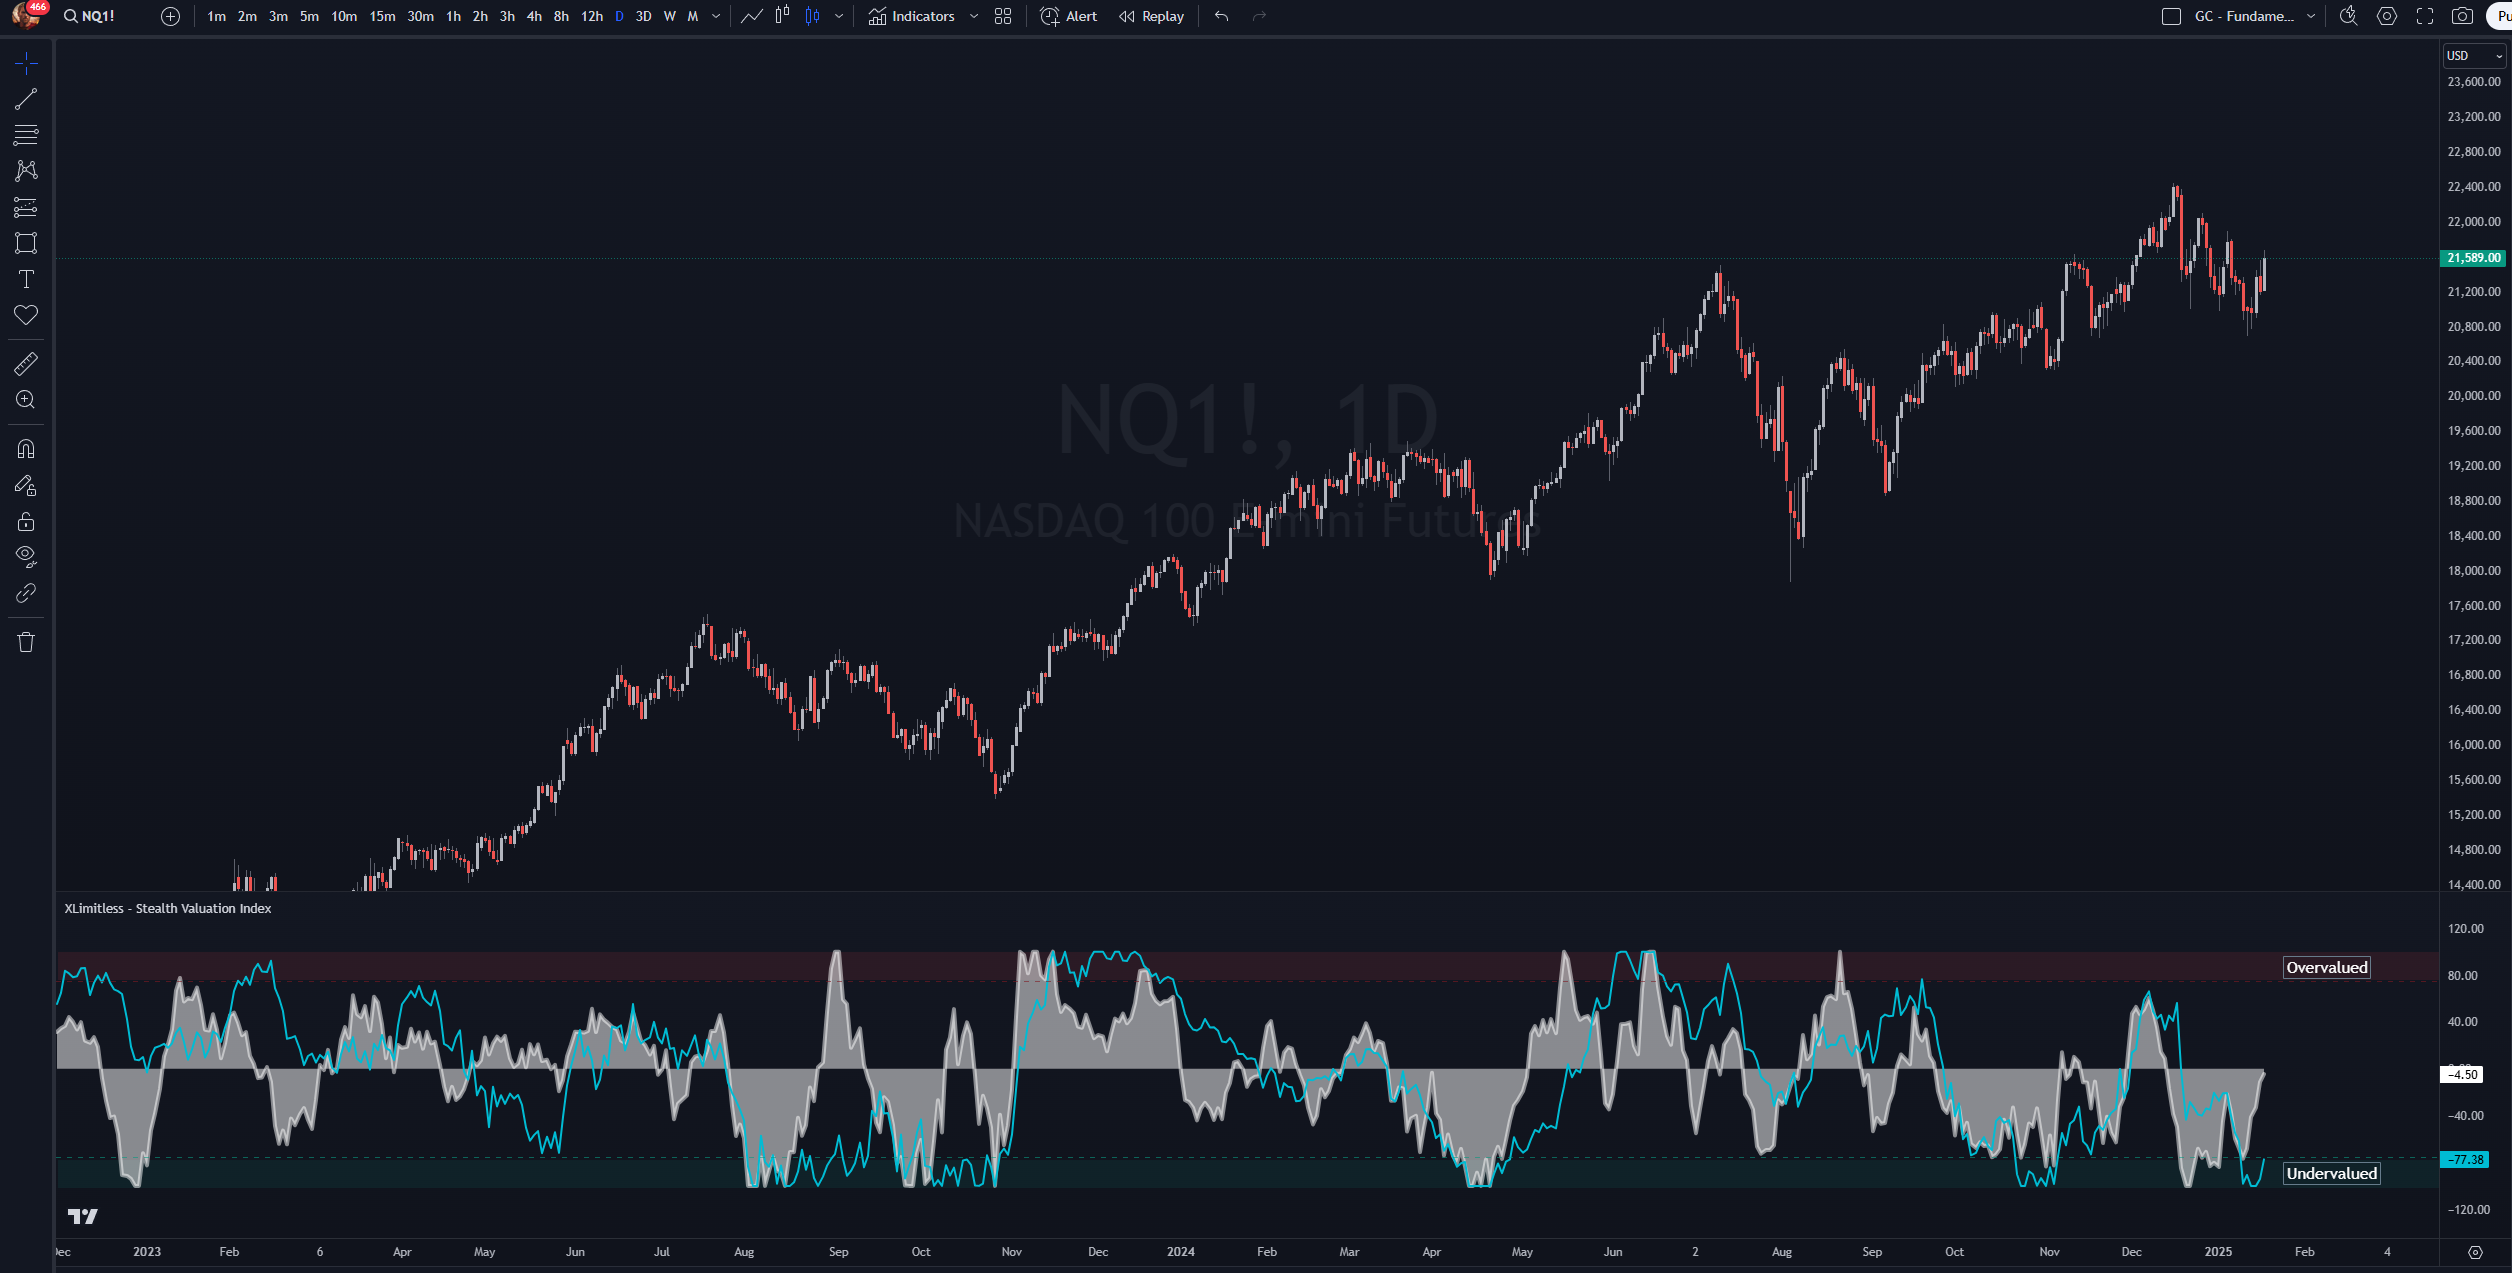
Retail traders buy high and sell low. Our Stealth Valuation Index™ flips the script. (SVI) shows real overvalued or undervalued metrics - so you can buy assets that are cheap and sell when they are expensive.
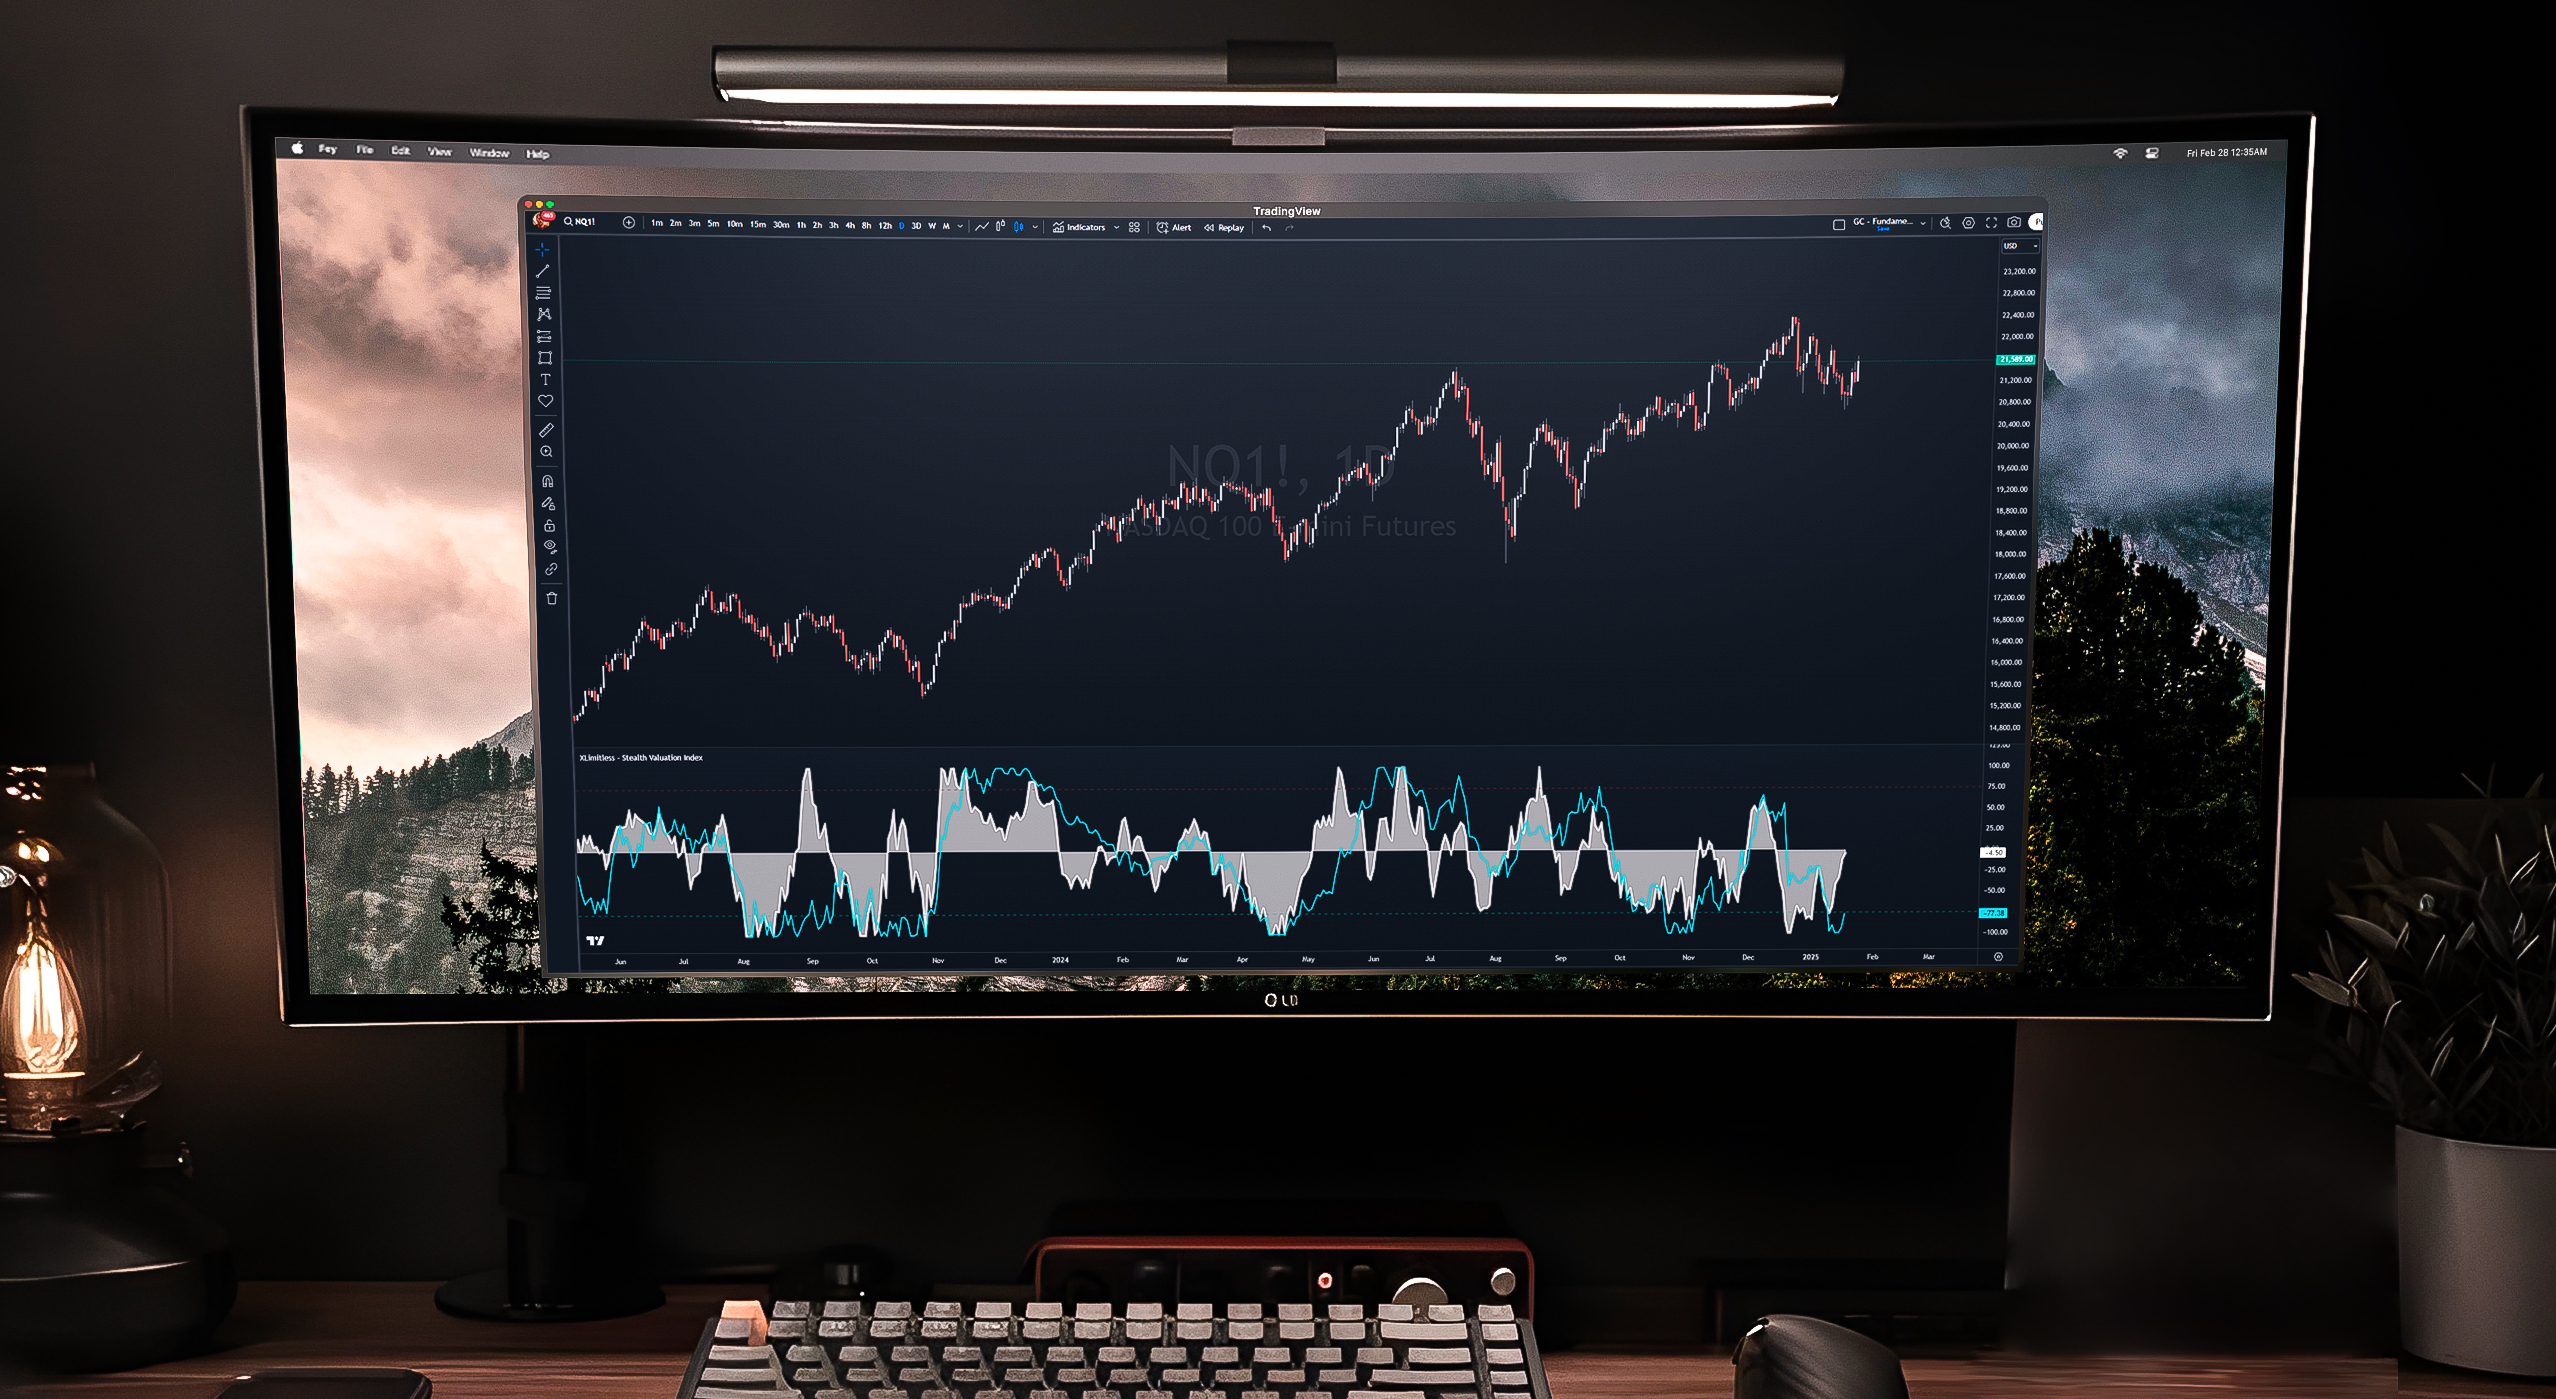
The "X Limitless - Stealth Valuation Index" is a versatile tool designed to compare the relative valuation changes of a primary asset against a selected benchmark symbol. This indicator normalizes and visualizes these comparisons, enabling traders to identify overbought or oversold conditions and make informed trading decisions.
1. Dynamic Comparison
2. Customizable Inputs
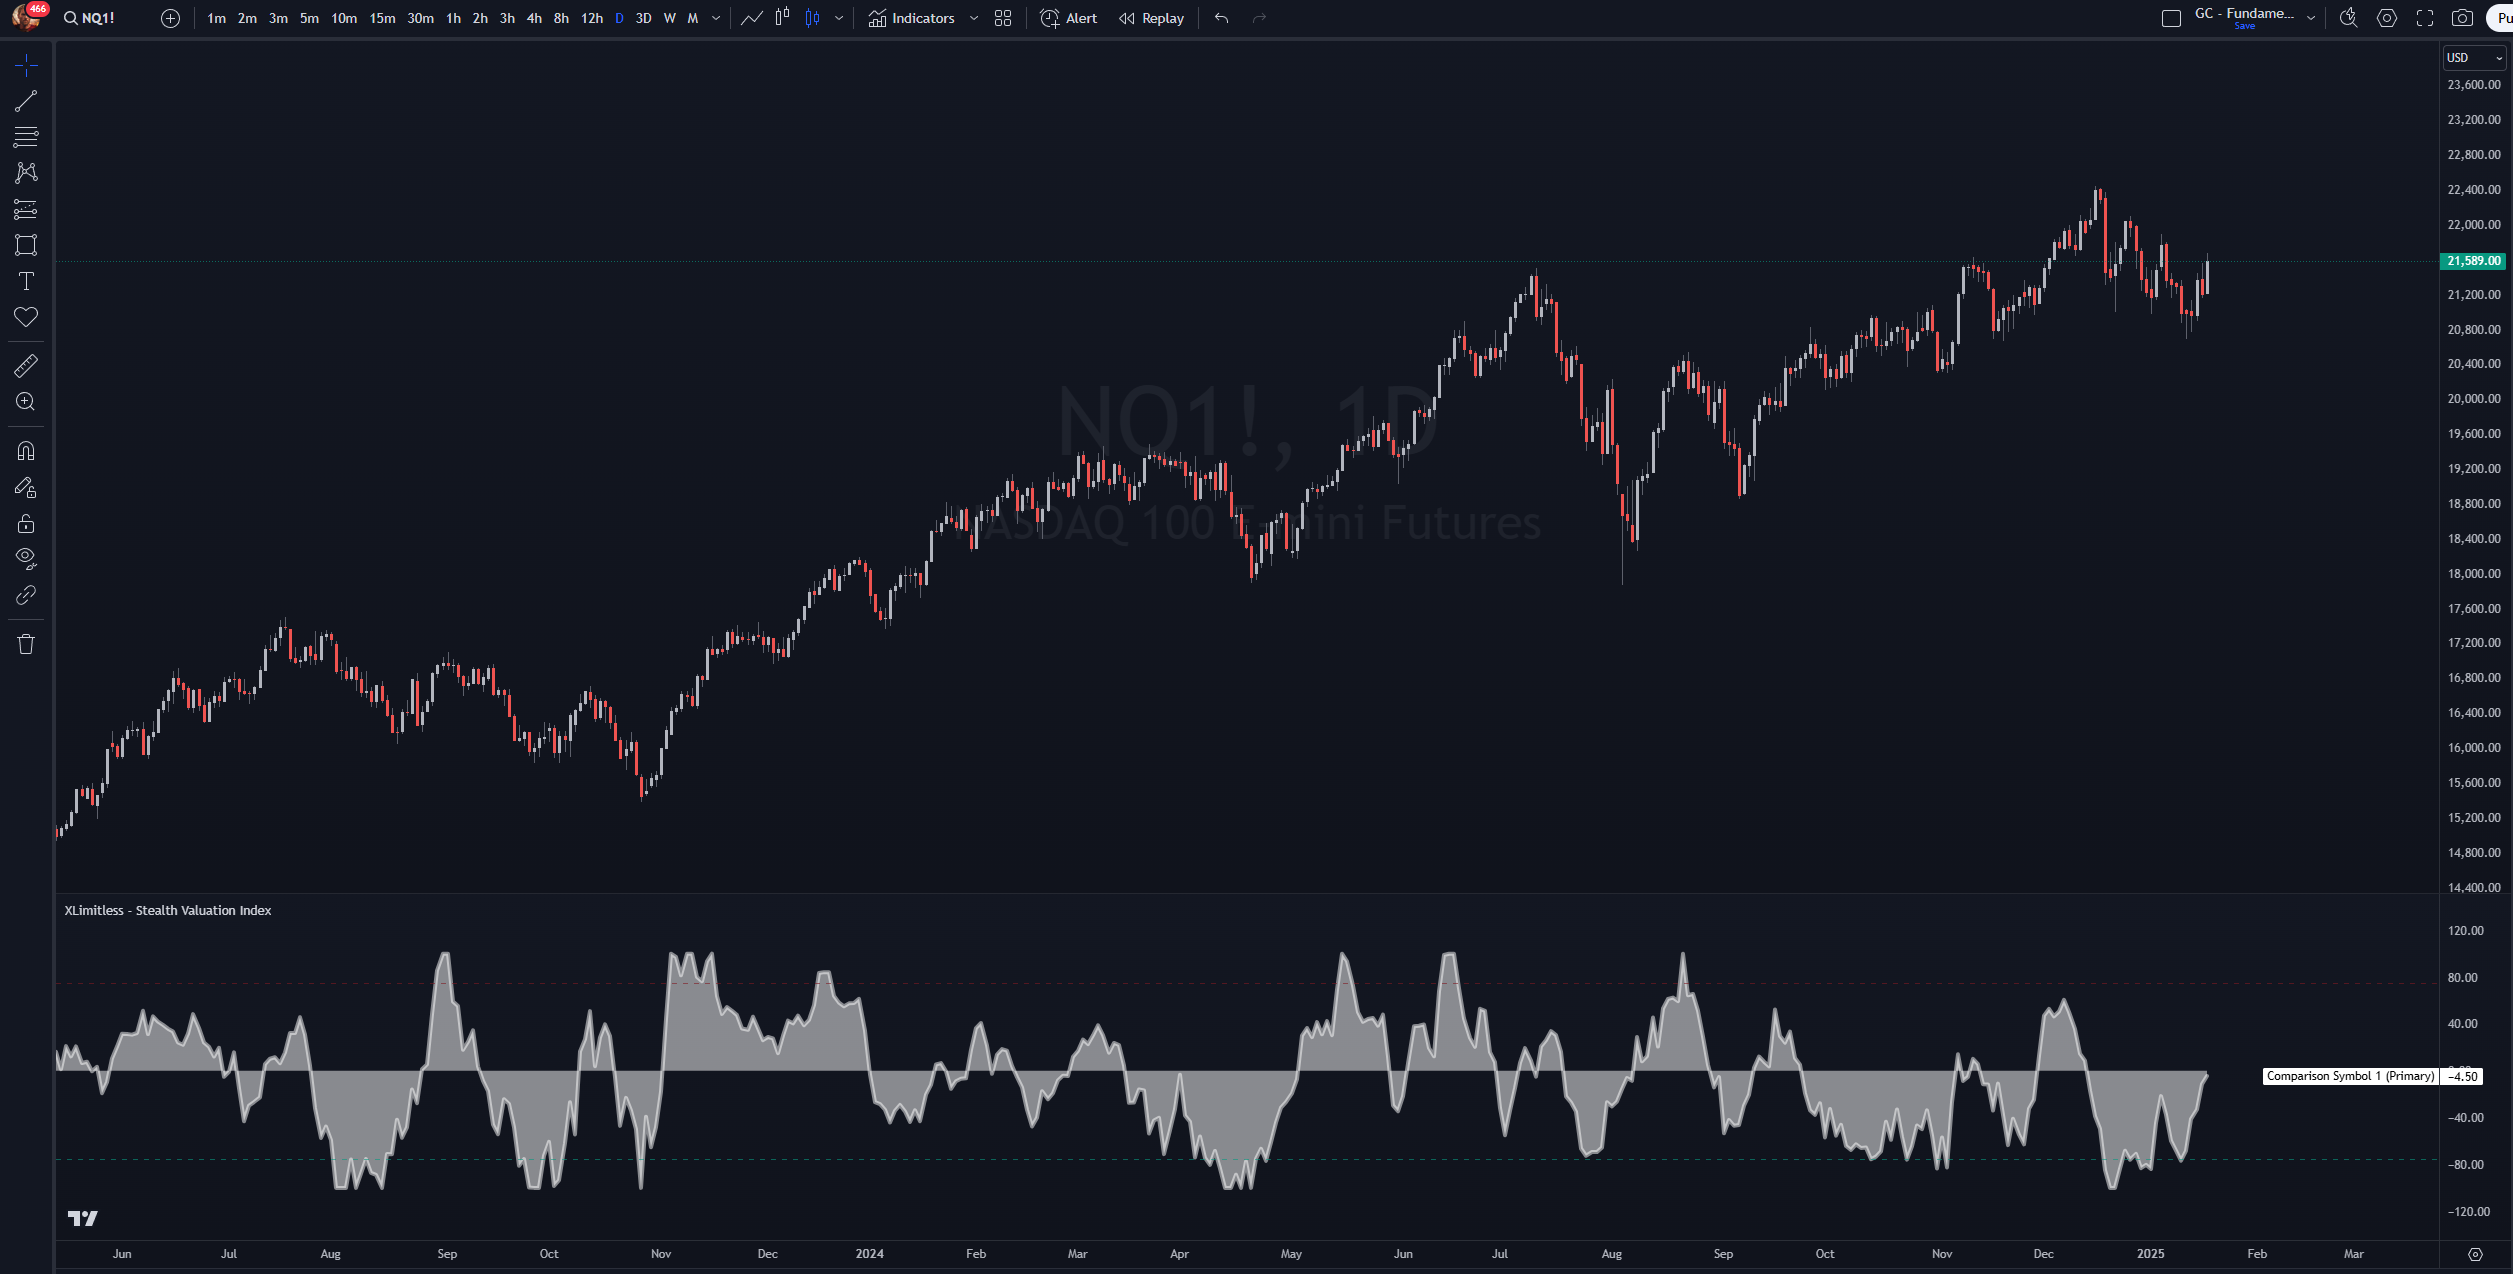
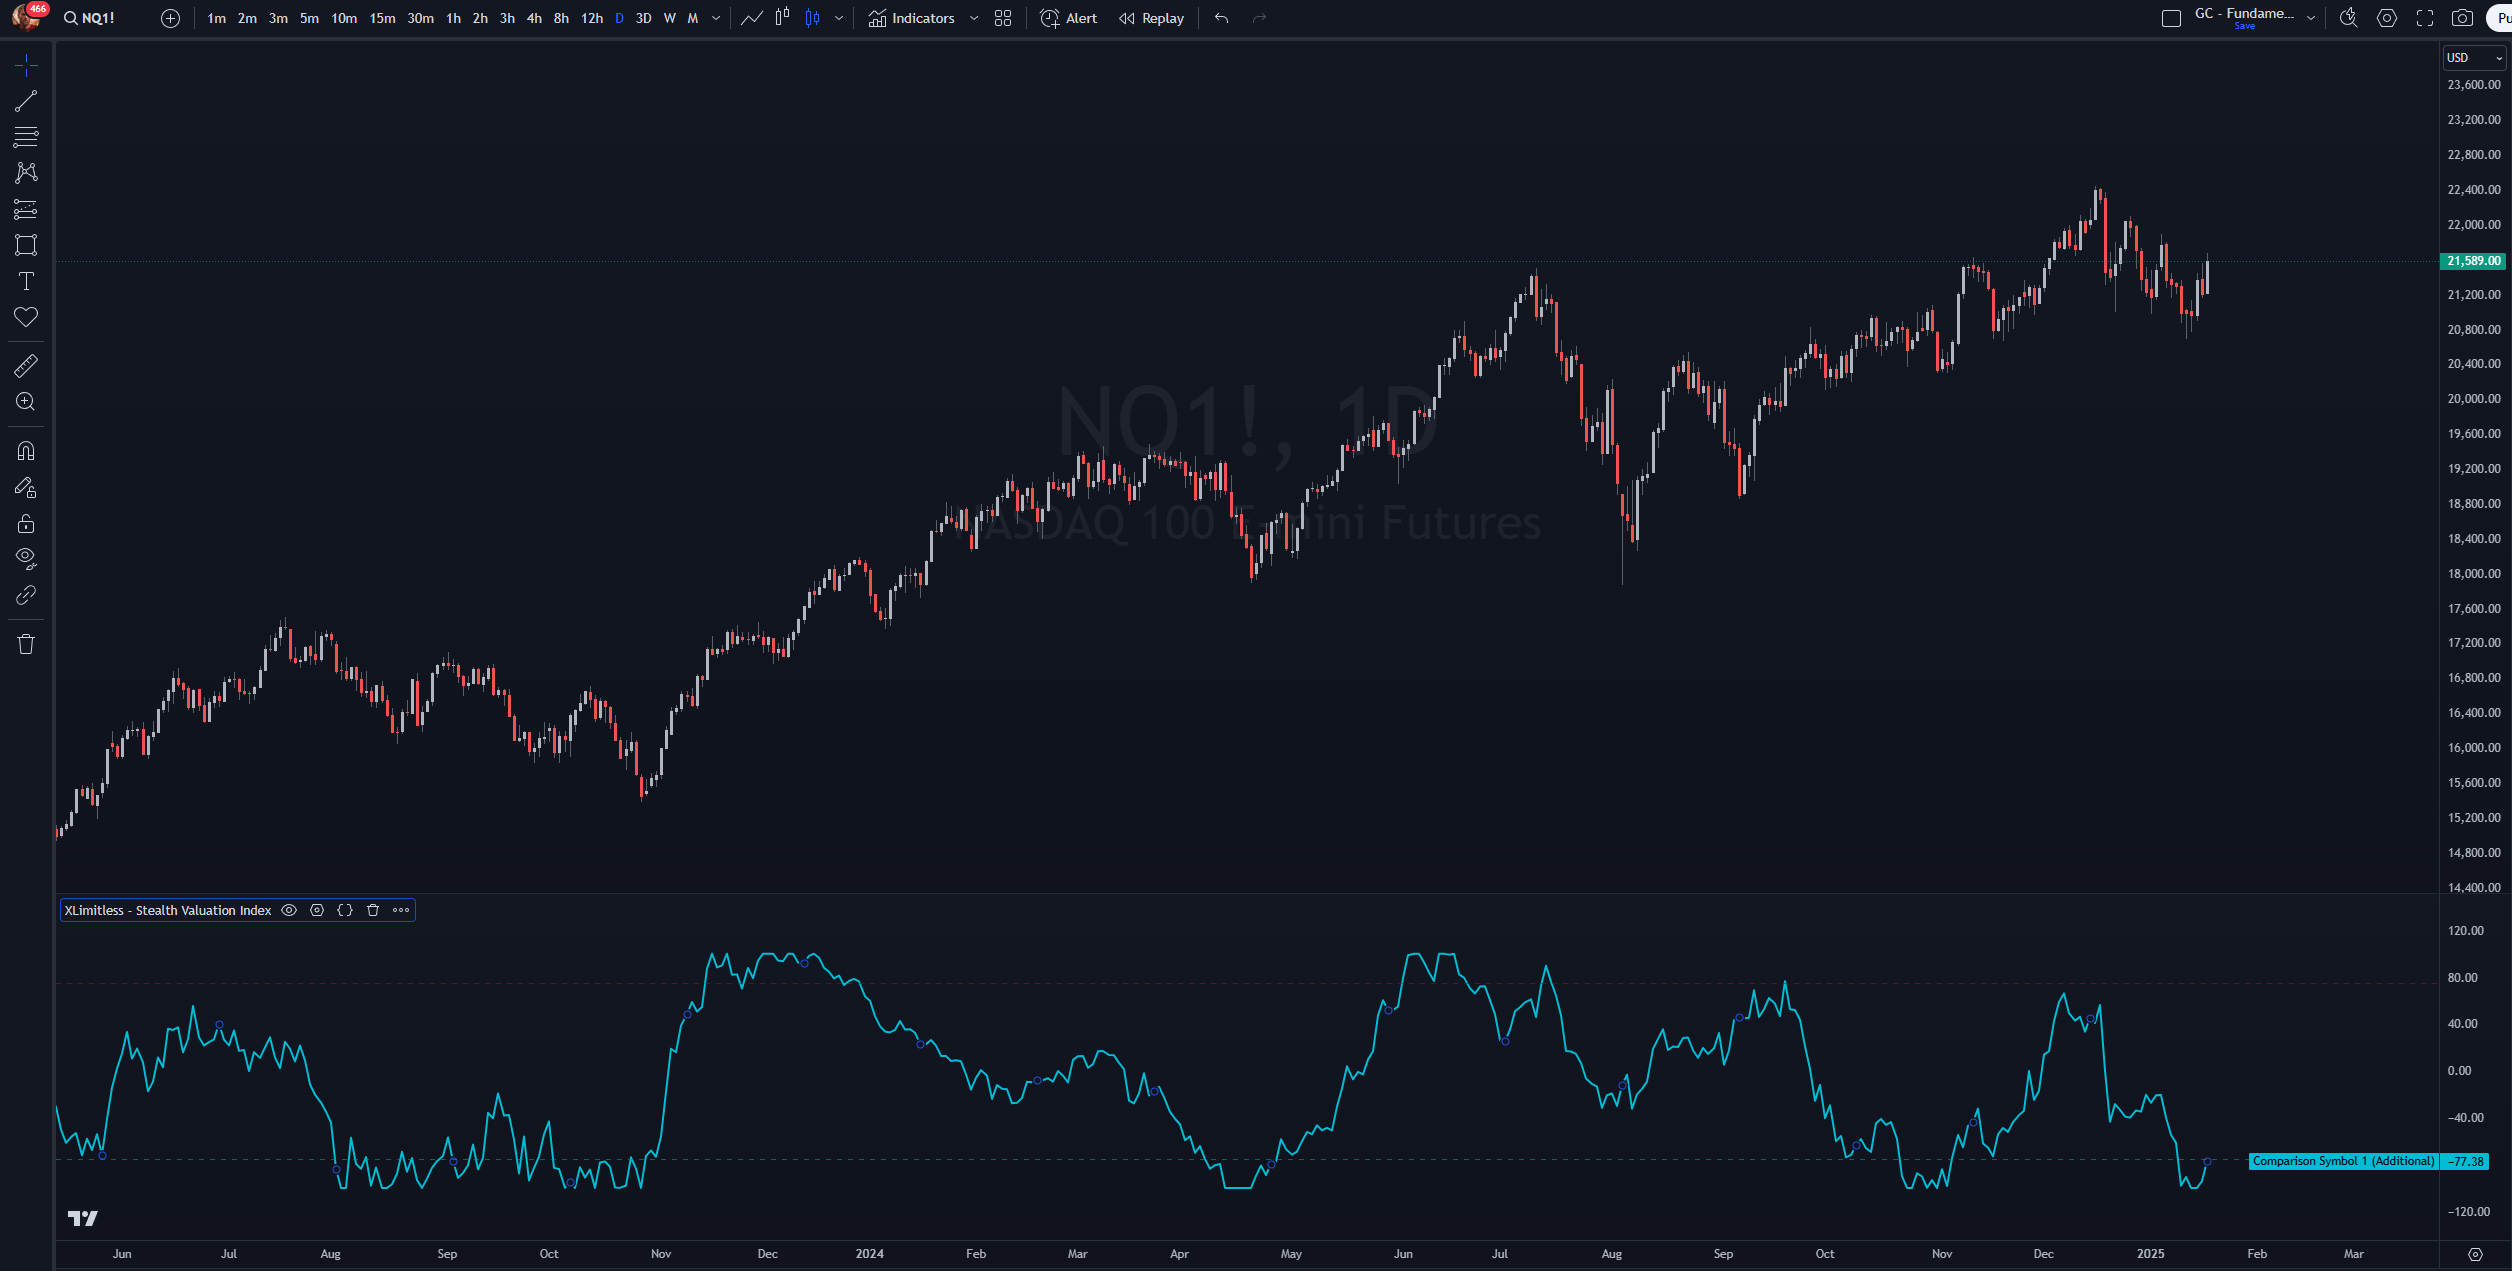
3. Graphical Representation
Adding the Indicator
1. Open TradingView.
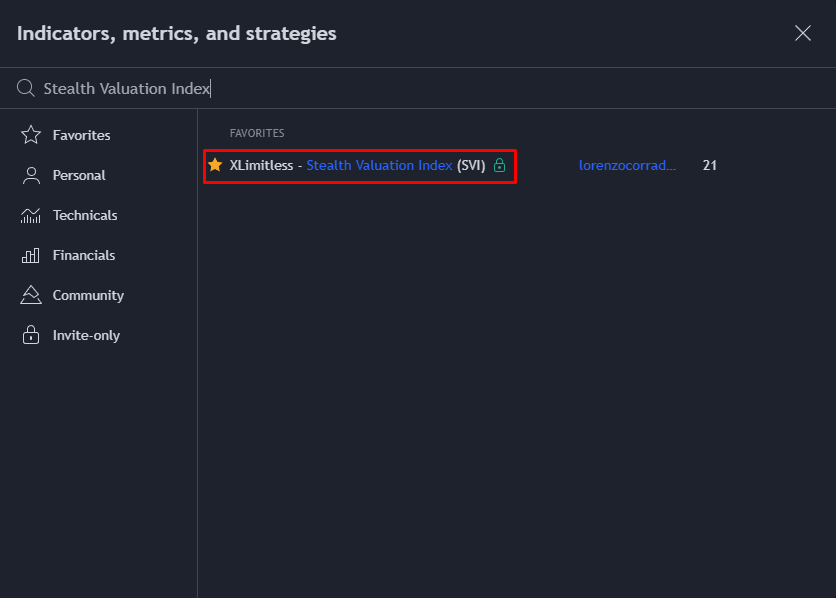
2. Navigate to the "Indicators" tab and click on “Invite Only”.
3. Search for "X Limitless - Stealth Valuation Index" and add it to your chart.
4. Apply the Intra-Day, Daily or Weekly Timeframe (Input will refer to the chosen timeframe).
Customizing Inputs
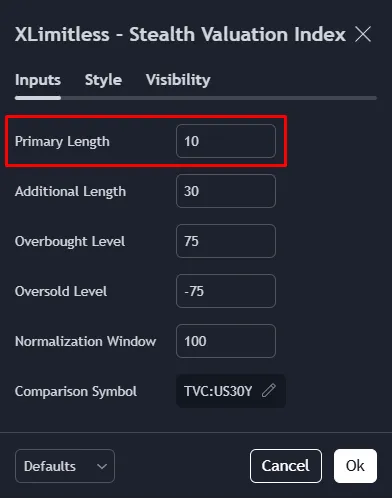
Primary Length (N):
Define the number of periods for short-term analysis (default: 10).
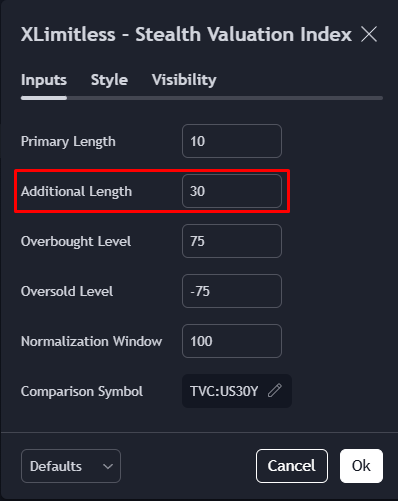
Additional Length:
Set the length for additional valuation analysis (default: 30).
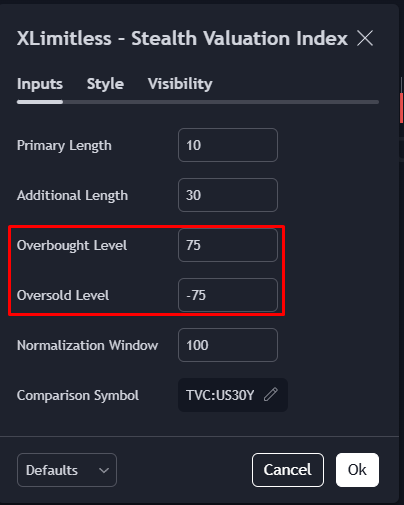
Overbought Level:
Oversold Level:
Normalization Window:
The Normalization Window is how far back the indicator looks to scale data between [-100, 100], helping you see how today’s values compare to the past. Use a shorter window for recent trends or a longer one to capture bigger picture movements.

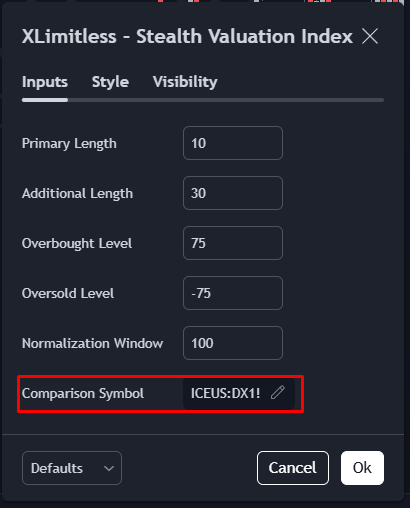
Comparison Symbol:
Input a benchmark symbol for valuation comparison (default: DX1! - Measured against the Dollar Futures).
Calculation Overview
1. Percentage Change:
2. Difference:
3. Normalization:
Plotting Mechanics
Best Practices
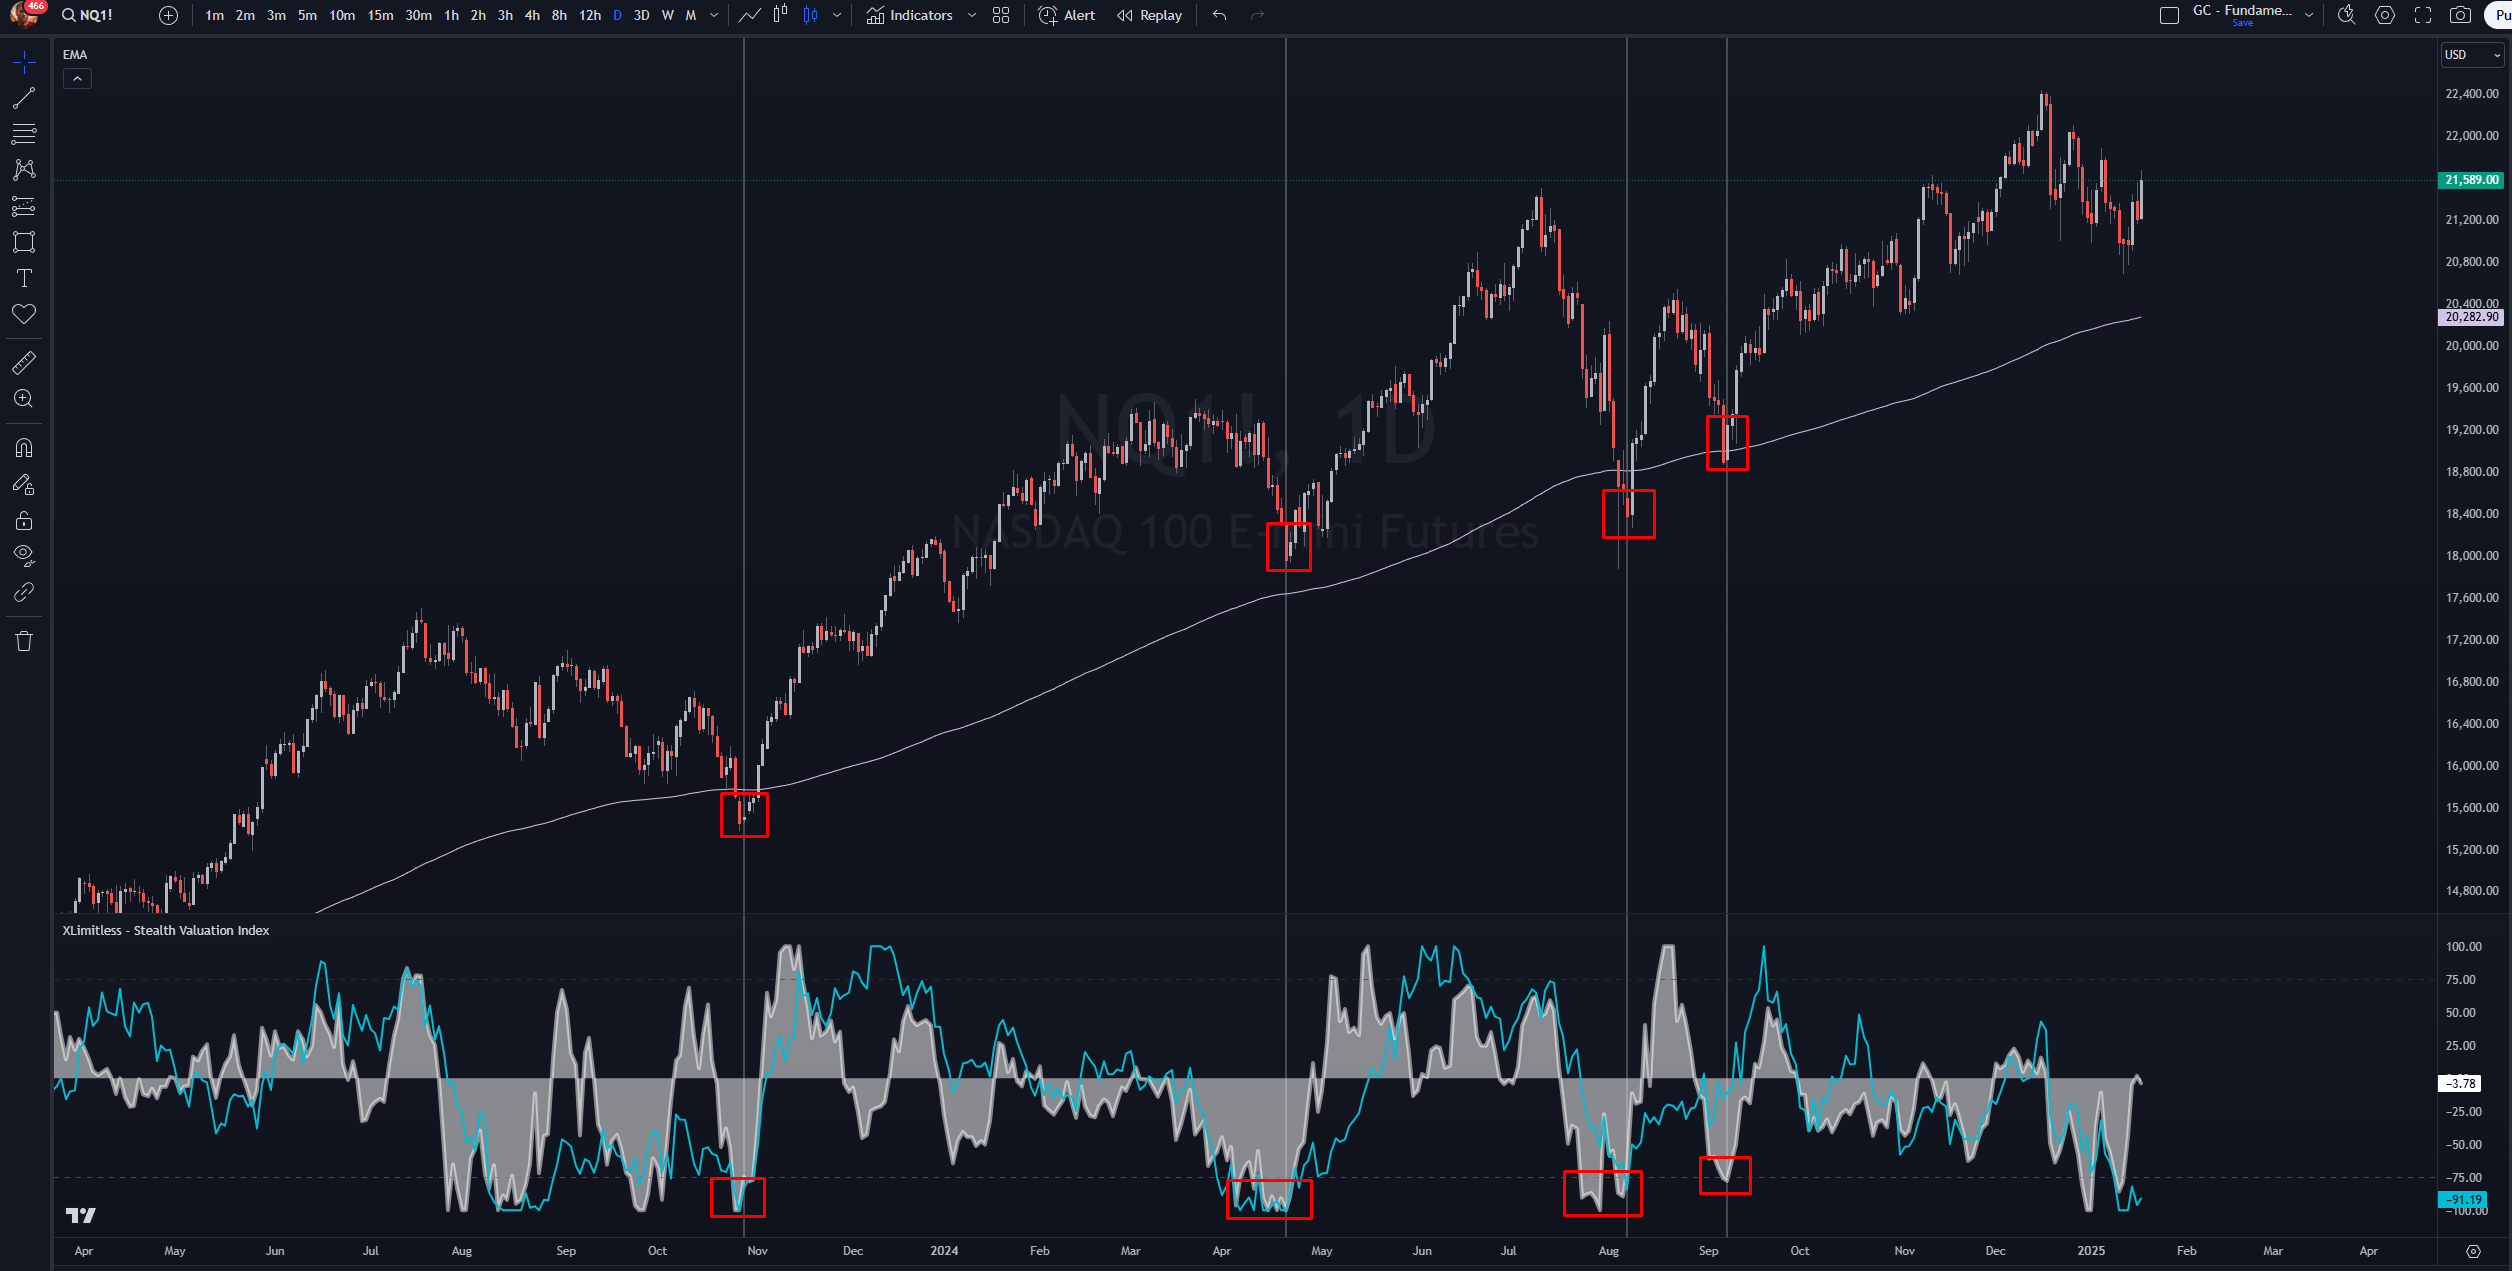
1. Combine with a Trend Confirmation
2. Focus on Extremes
3. Adjust Thresholds
Scenario:
Steps:
1. What does normalization do?
2. Can I compare multiple symbols?
3. Why are my plots flat?
Disclaimer
The Stealth Valuation Index is a powerful tool designed to assist in analyzing asset valuations and market trends; however, it should not be considered financial advice or a guaranteed predictor of market movements. Trading involves significant risk, and past performance does not guarantee future results. Always use this tool in conjunction with other analysis methods and perform your own due diligence before making any investment decisions. The user assumes all responsibility for their trading actions and the associated risks.
