
Documentation

Quickstart

Identify seasonal market trends with The Alpha Screener™. By analyzing years of historical performance and identifying dominant months and days - you'll highly increase your edge.
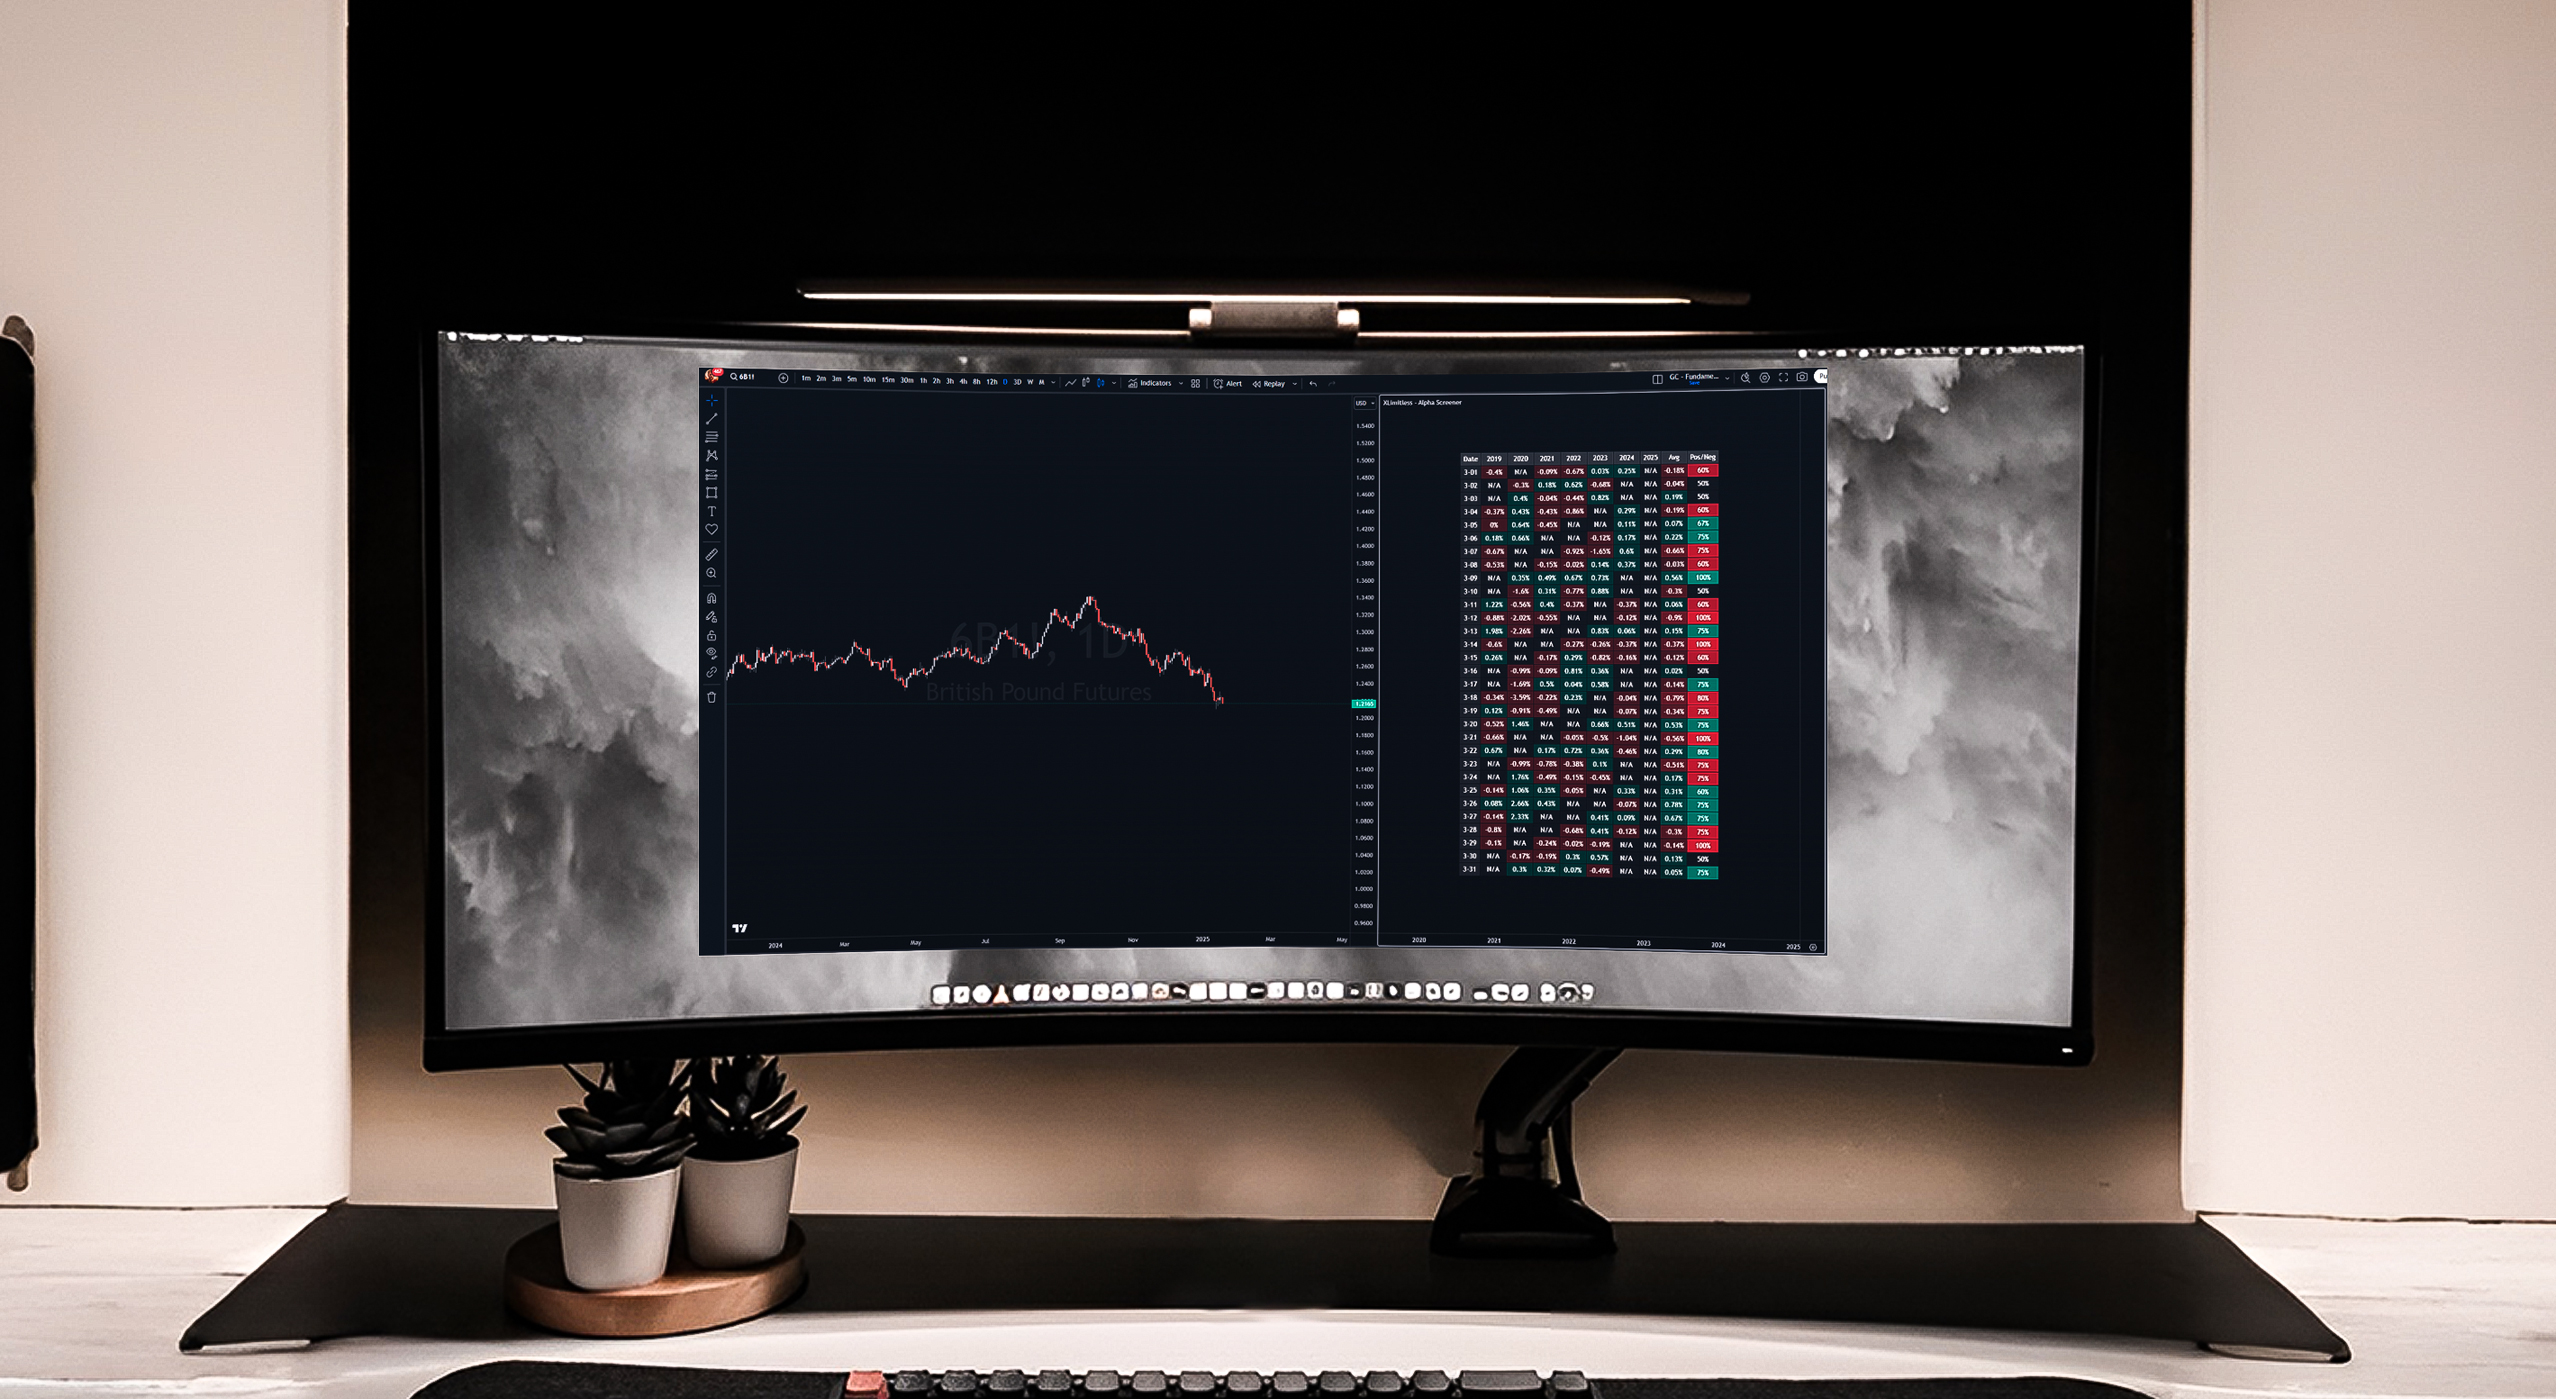
The "X Limitless - Alpha Screener" is an advanced tool designed to analyze historical performance patterns for a selected month across multiple years. By identifying trends and highlighting dominant positive or negative periods, this screener provides actionable insights into seasonal daily market behaviors.
1. Seasonal Analysis
2. Customizable Timeframes
3. Dynamic Visualization
4. Table Customization
Adding the Indicator
1. Open TradingView.
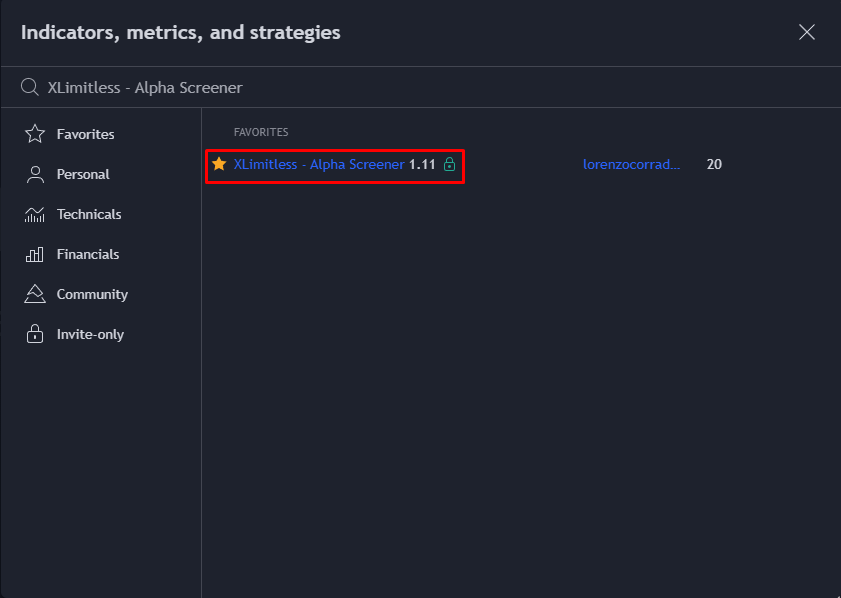
2. Navigate to the "Indicators" tab and click on “Invite Only”.
3. Search for "X Limitless - Alpha Screener" and add it to your chart.
4. Apply the Daily Timeframe.
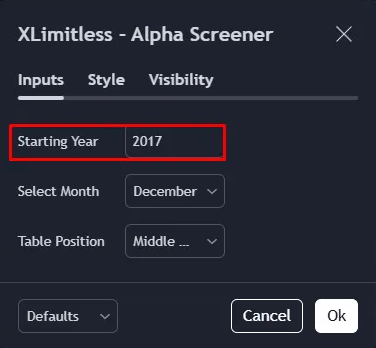
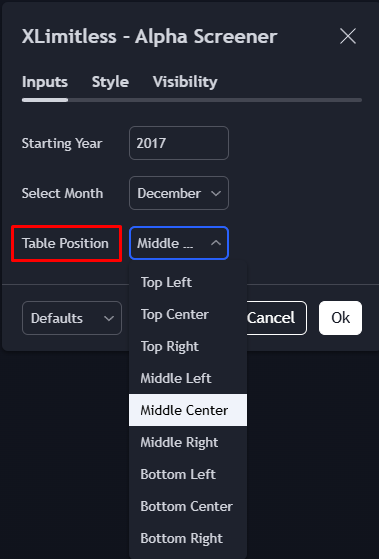
Customizing Inputs
Starting Year:
Select Month:
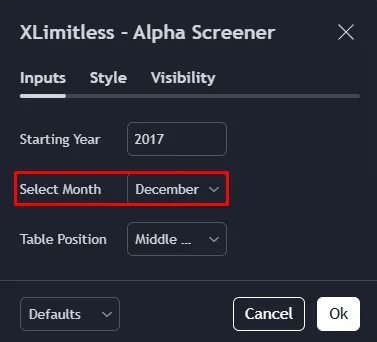
Table Position:
Data Collection
1. Historical Data Extraction:
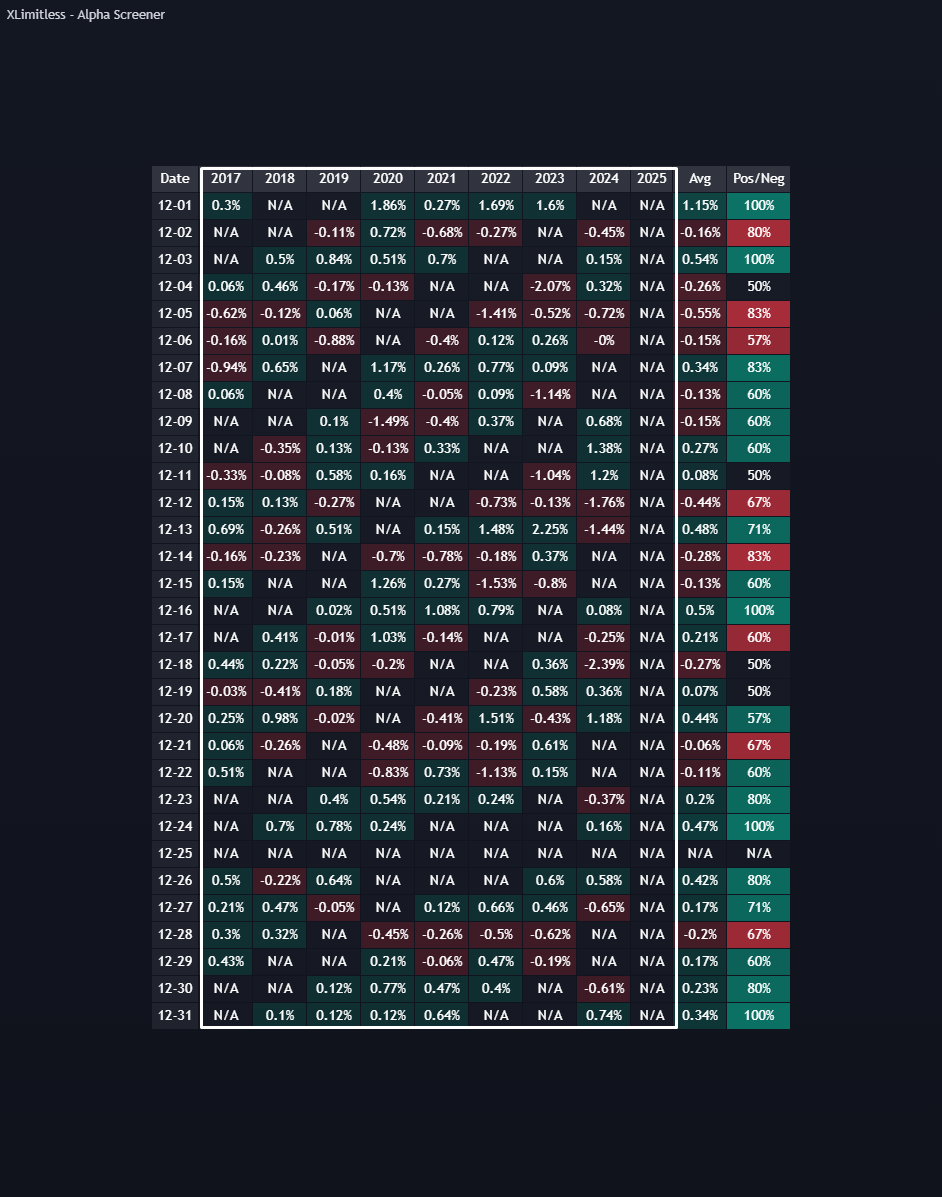
2. Calculation Logic:
For each day in the selected month:
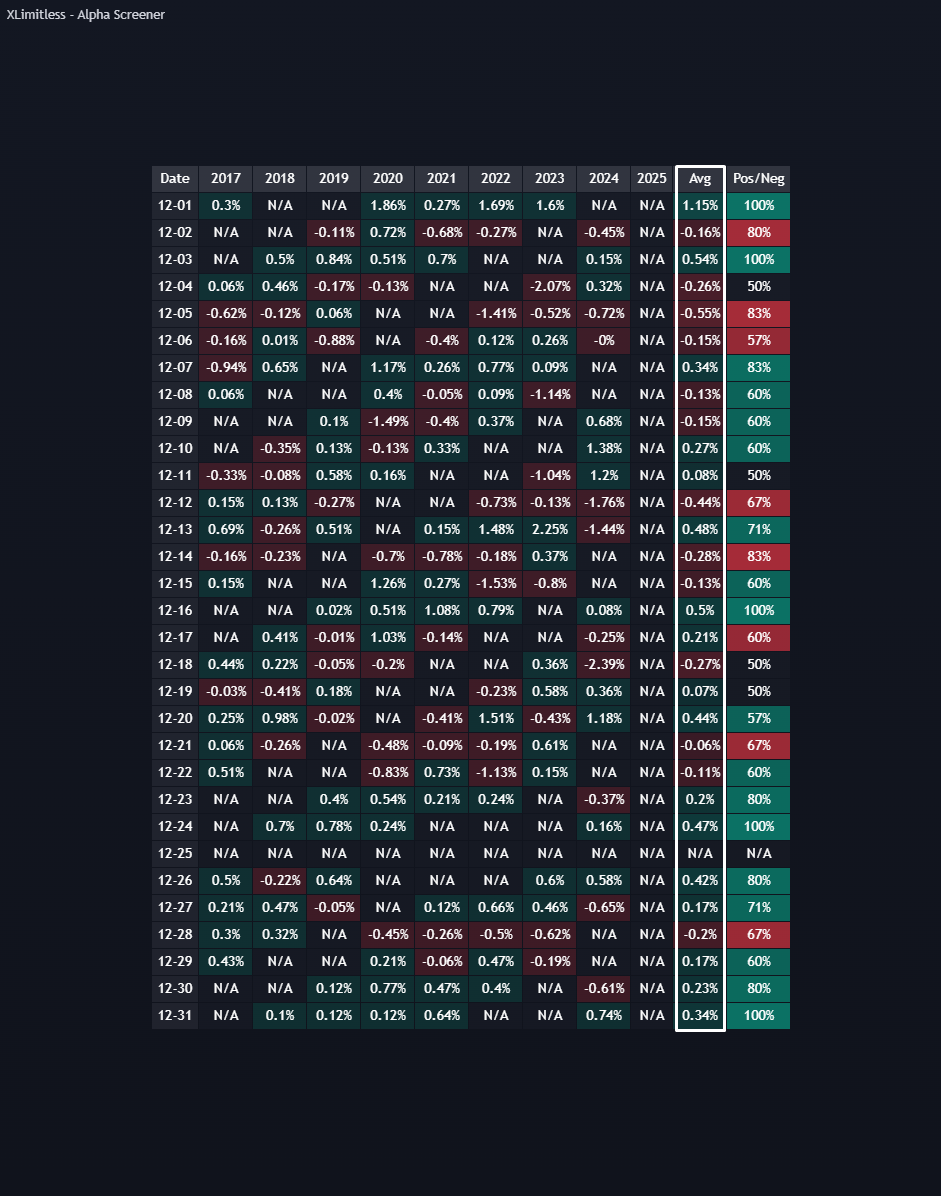
3. Trend Analysis:
Best Table Visualization
Best Practices
1. Focus on High-Impact Days
2. Combine with Seasonal Indicators
3. Leverage Table Placement
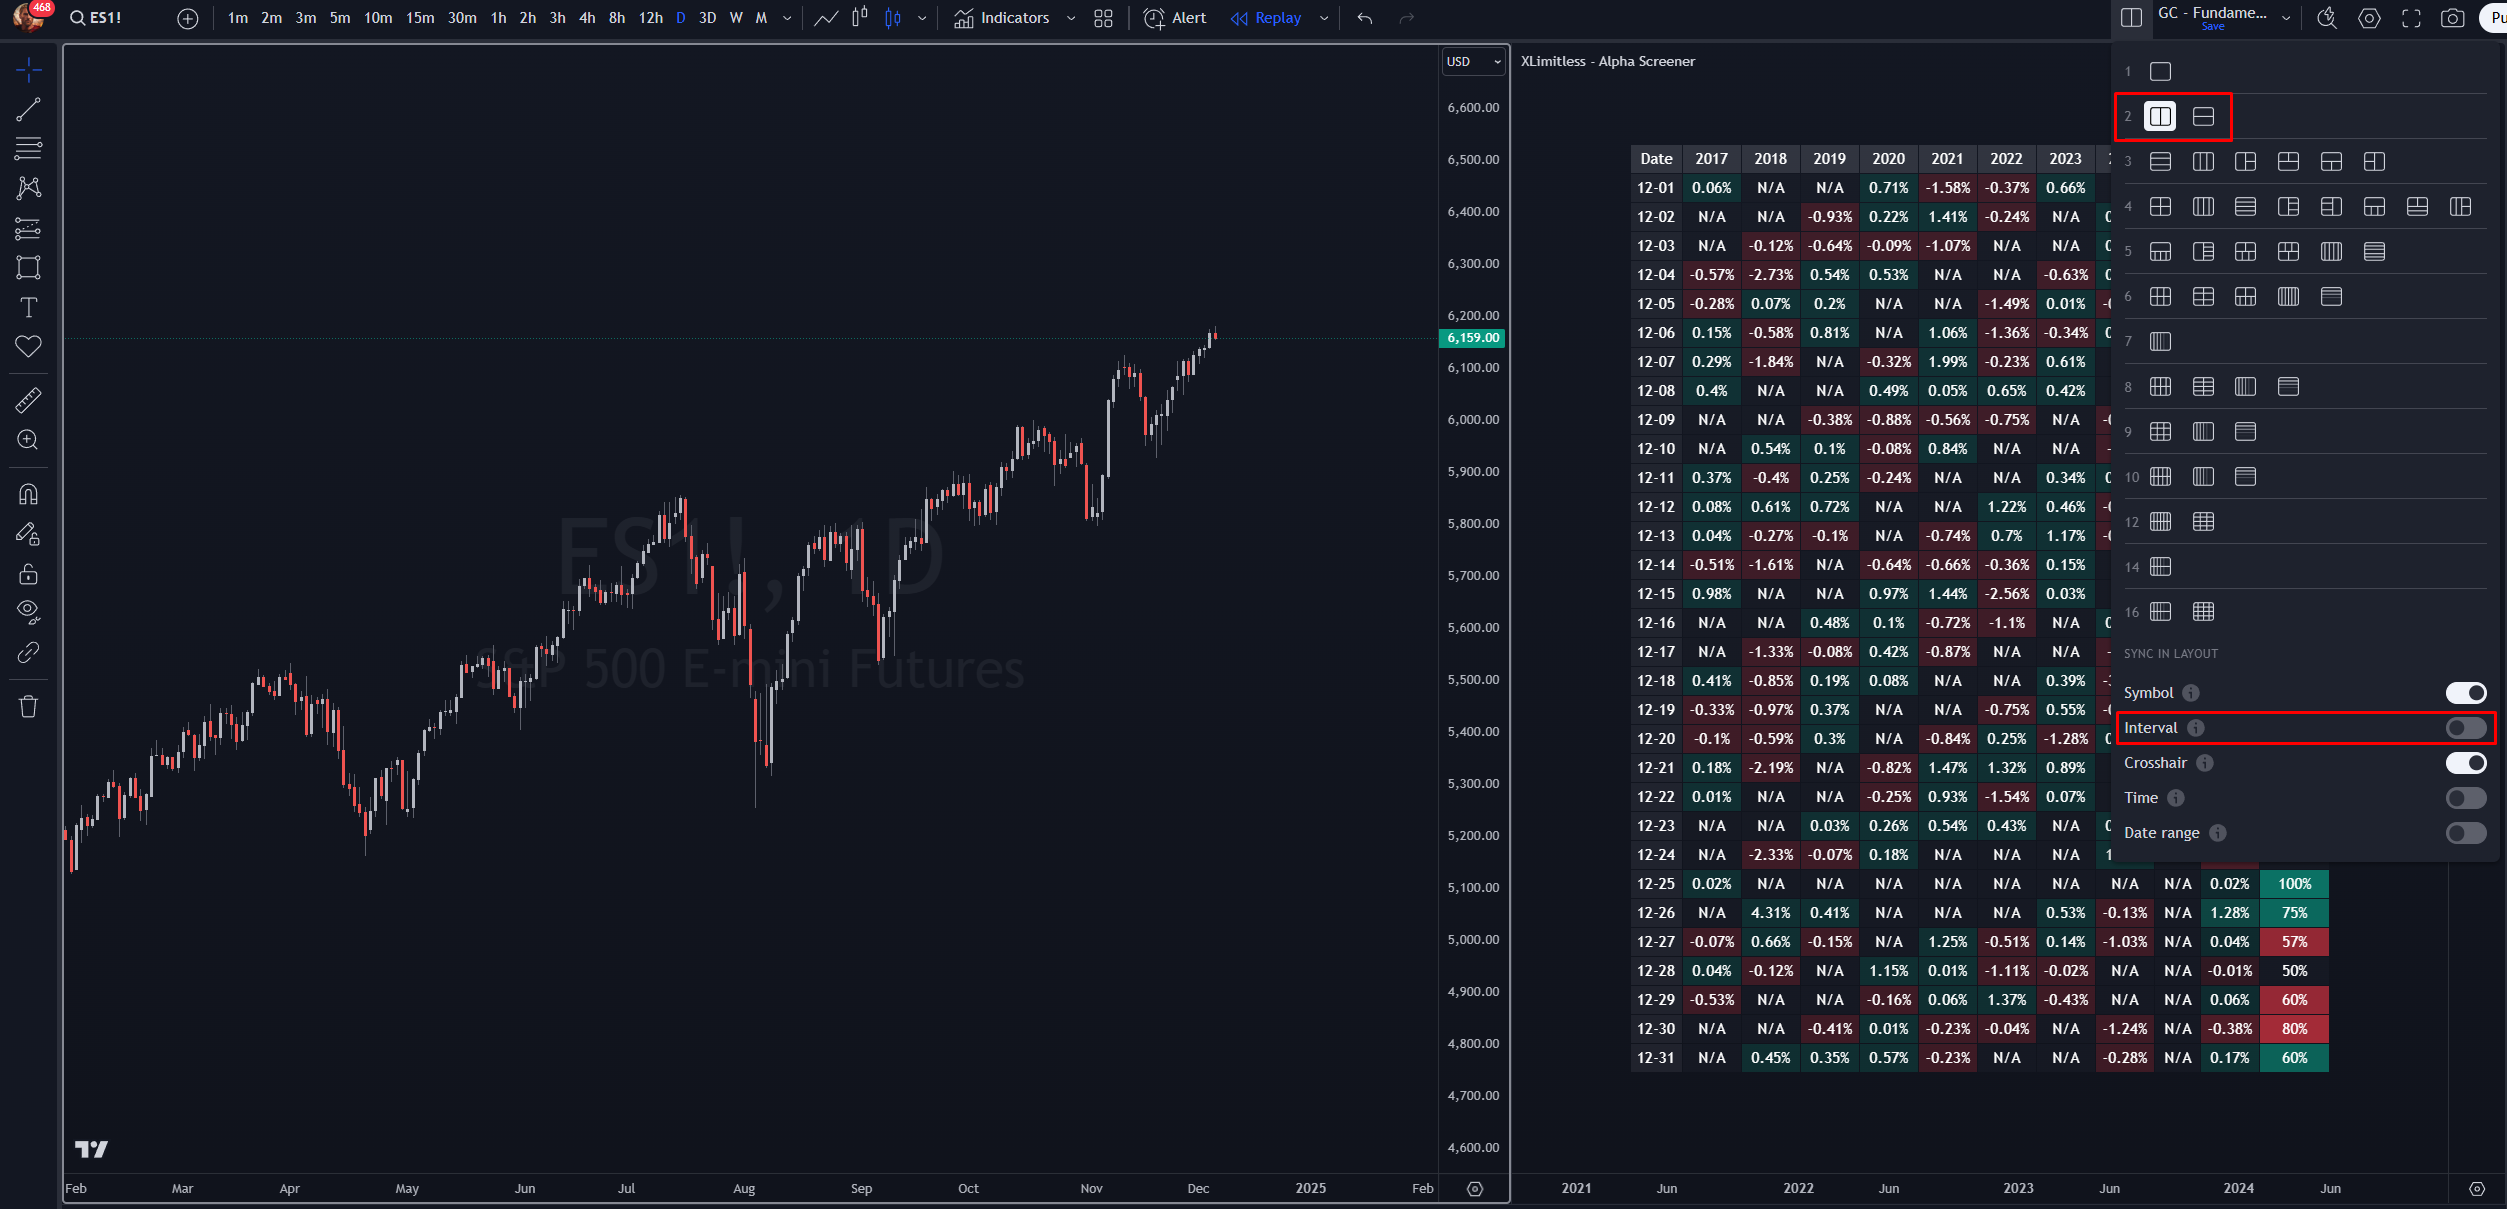
Make sure you put this window on the Daily Timeframe and turn the “Interval” Synchronization off.
Scenario:
Steps:
1. Why are some cells showing "N/A"?
2. Can I analyze multiple months simultaneously?
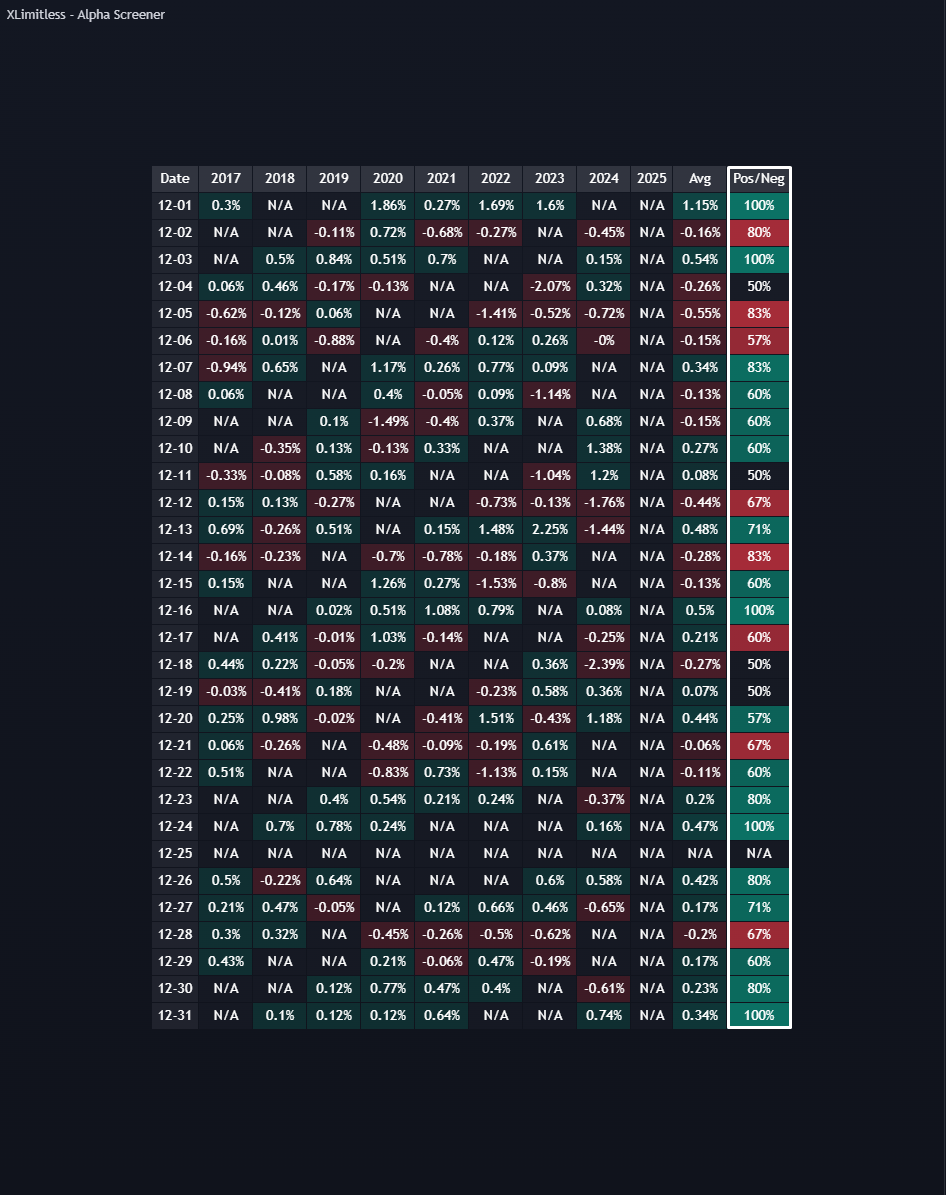
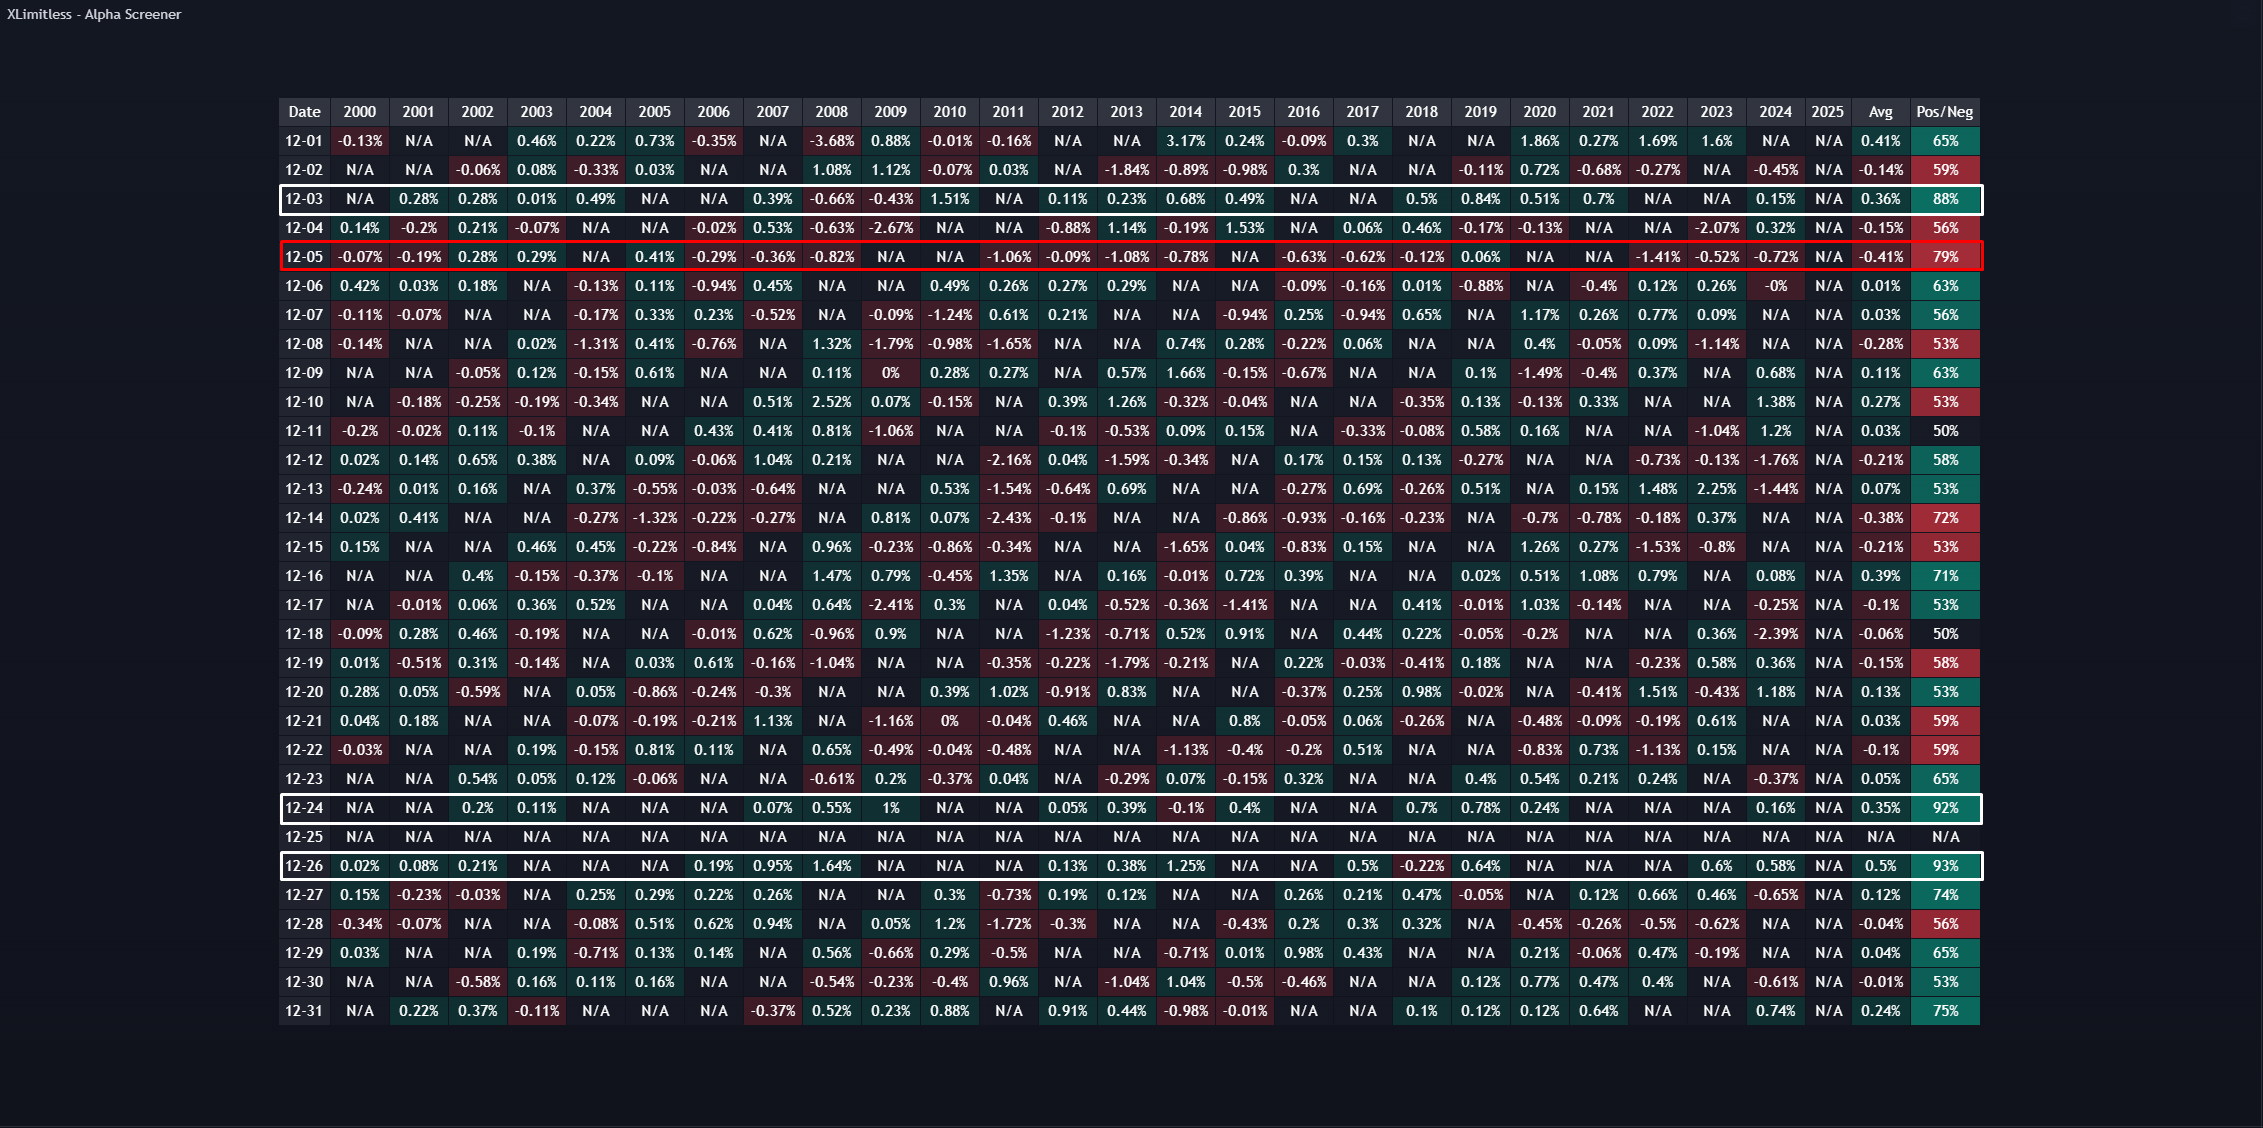
3. What does the Pos/Neg column represent?
4. Does this work for intraday data?
Disclaimer
The X Limitless Alpha Screener is a tool designed to analyze historical performance patterns and provide insights into seasonal trends; however, it is not a guarantee of future market behavior or trading outcomes. Trading involves significant risk, and past performance is not indicative of future results. This tool should be used in conjunction with other analysis methods and does not replace professional financial advice. Users are solely responsible for their trading decisions and any associated risks.
