
Documentation

Quickstart

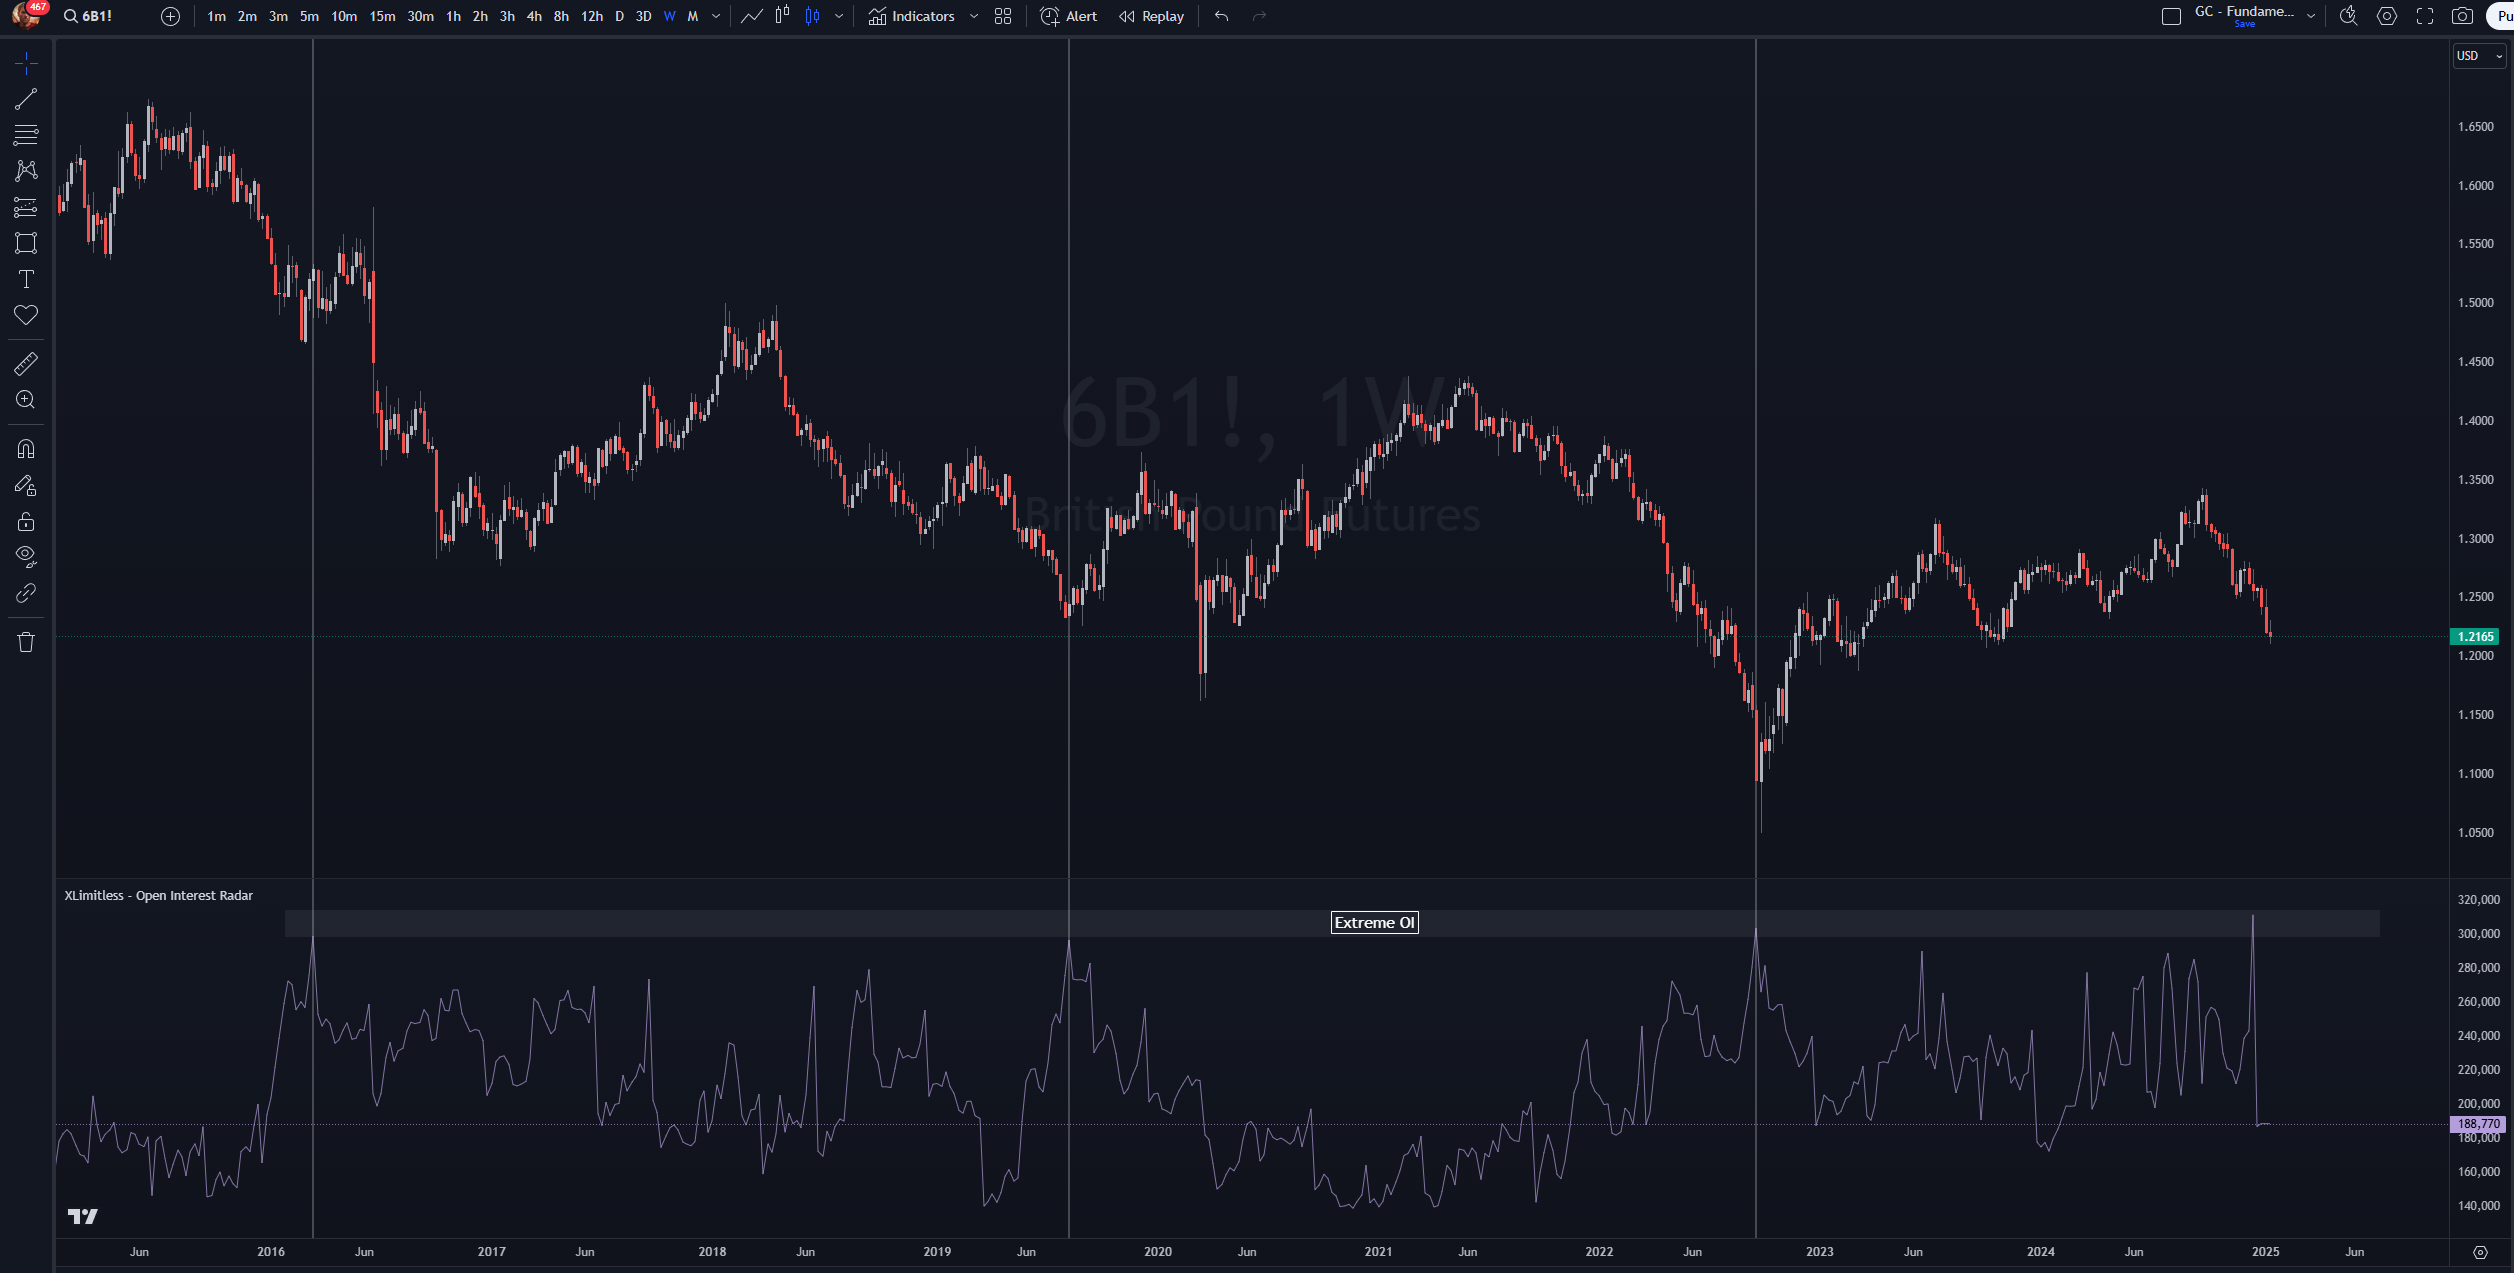
Predict the market’s next move. The Open Interest Radar™ reveals potential reversals, helping you spot trends early. Protect yourself from smart money liquidations and outsmart the competition.
The "X Limitless - Open Interest Radar" is a powerful tool designed to track Open Interest data across various futures contracts. By visualizing changes in Open Interest, this indicator provides insights into market participation, helping traders identify potential trends and reversals, gaining the understanding if a trend is strong, or weakening.
1. Open Interest Visualization
2. Simplistic Design
3. Versatility
Adding the Indicator
1. Open TradingView.
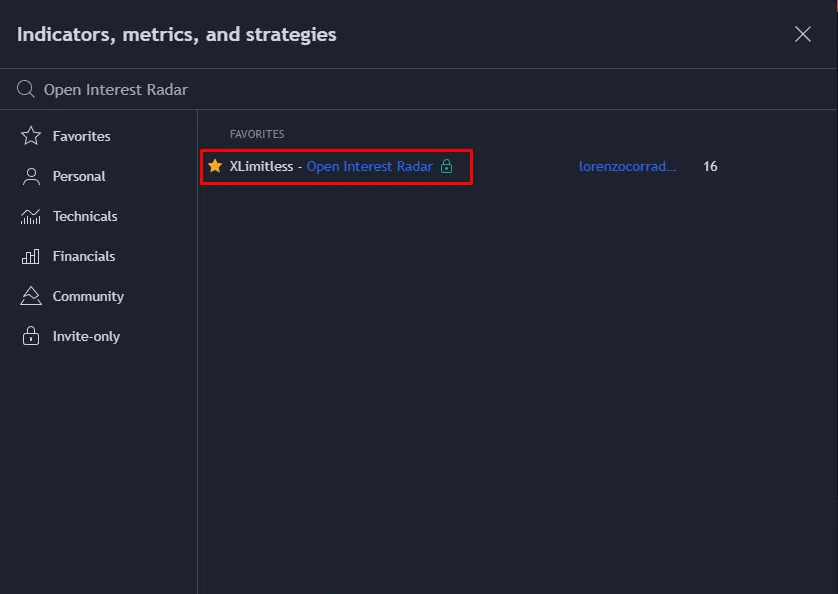
2. Navigate to the "Indicators" tab and click on “Invite Only”.
3. Search for "X Limitless - Open Interest Radar" and add it to your chart.
4. Apply the Weekly Timeframe
Customizing Inputs
Data Source
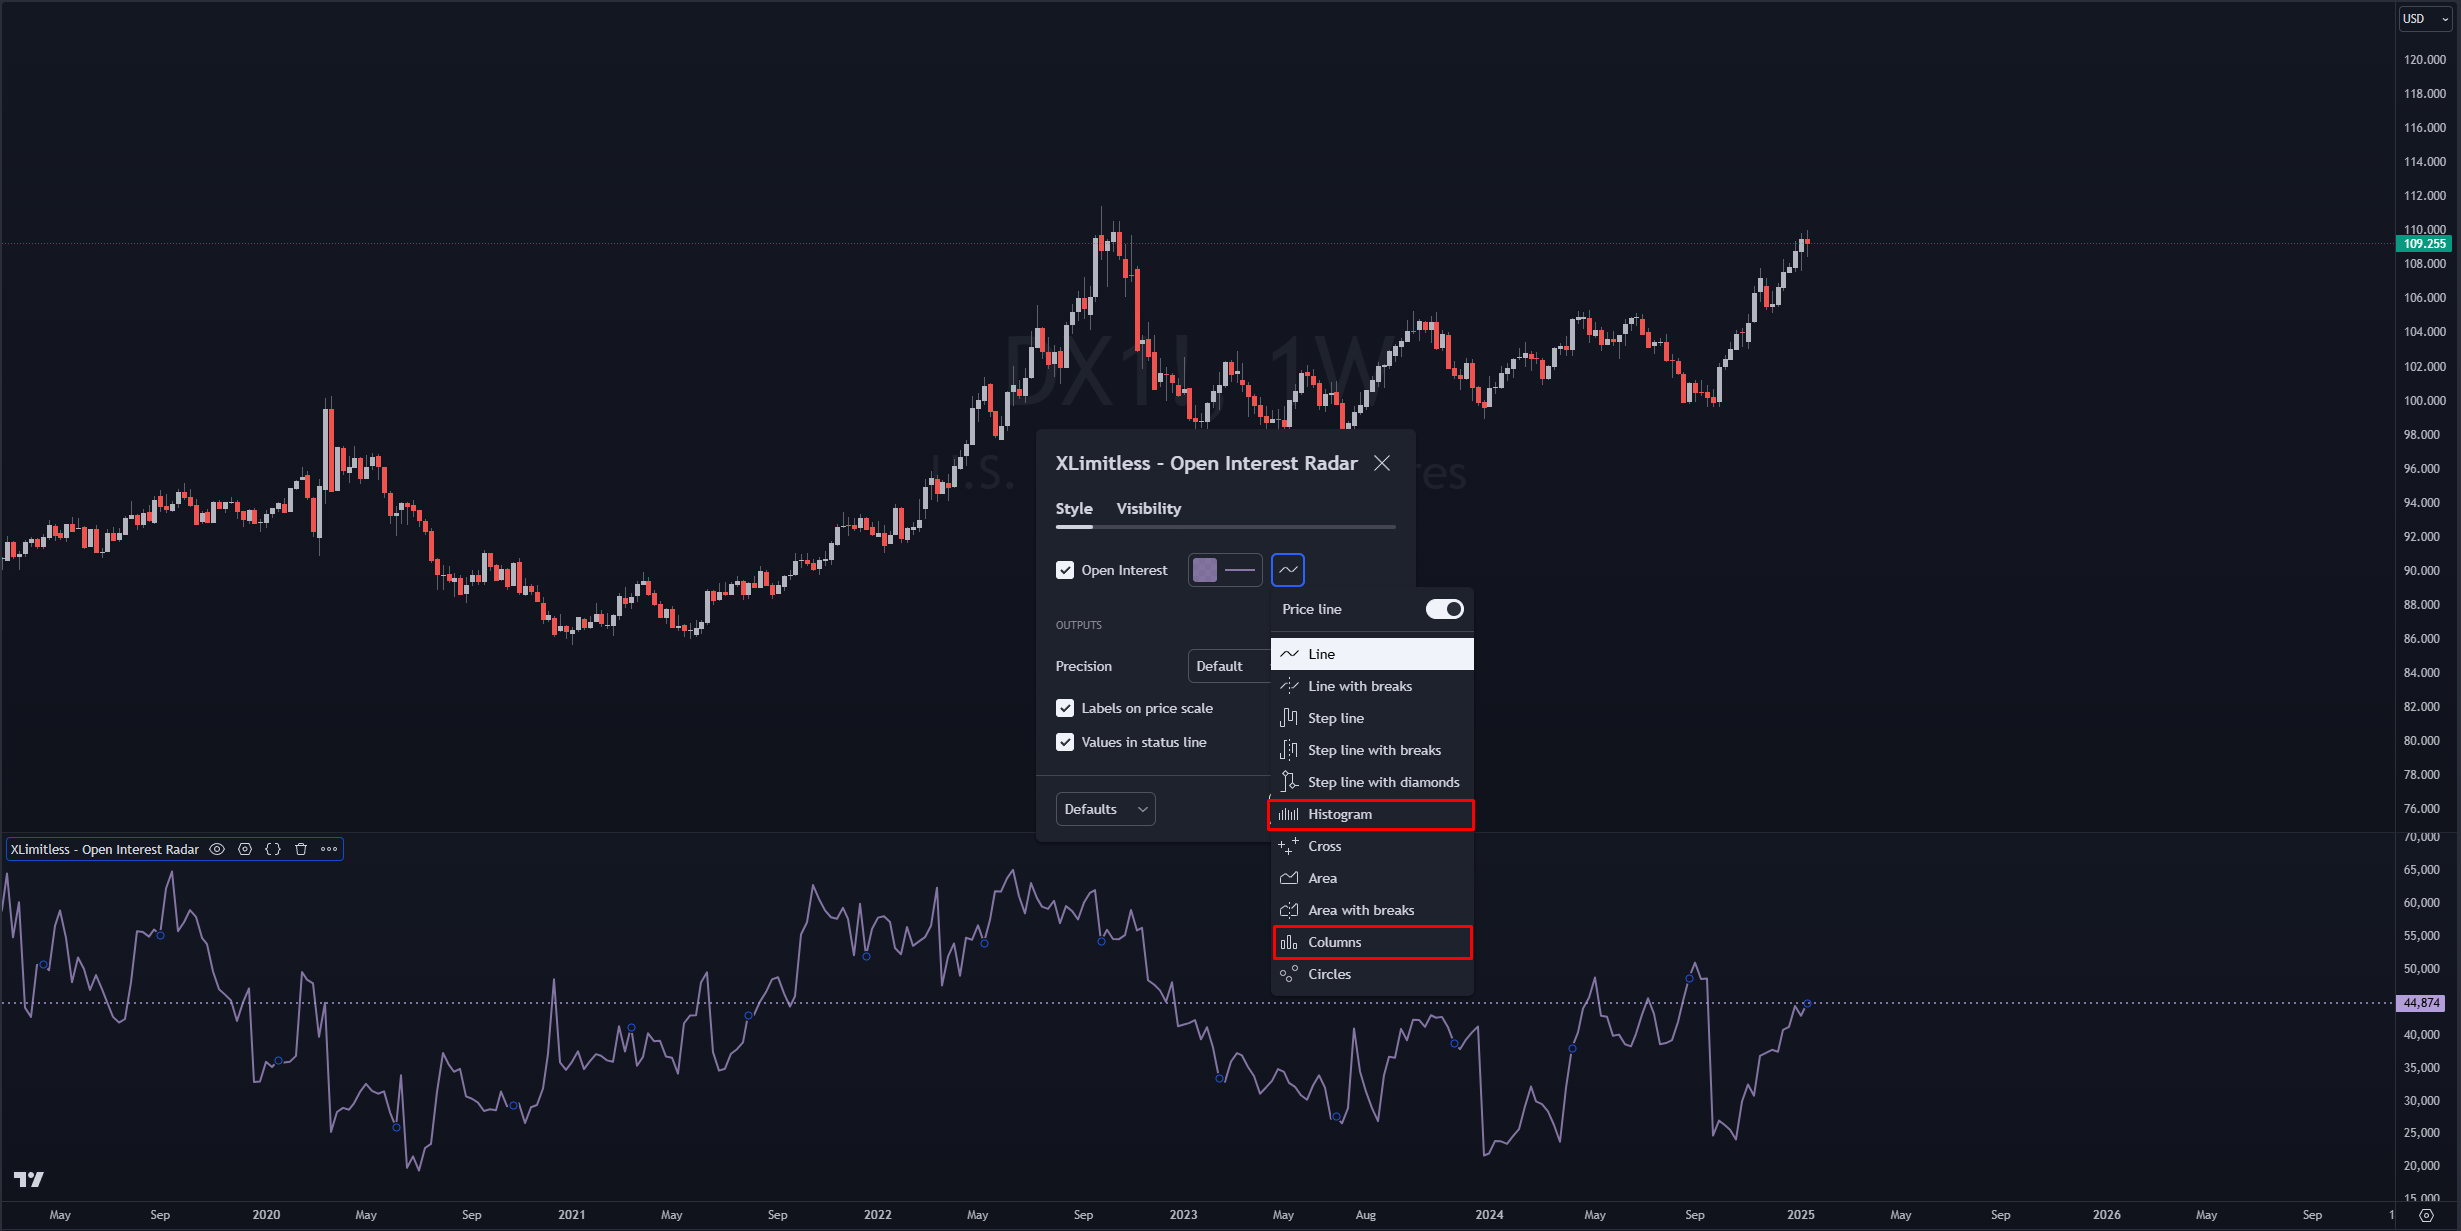
Plotting Mechanics
Open Interest Line:
Best Practices
1. Combine with Sentiment Analysis (COT)
2. Monitor Spikes
3. Use Weekly Timeframe
4. Integrate with Other Tools
Scenario:
Steps:
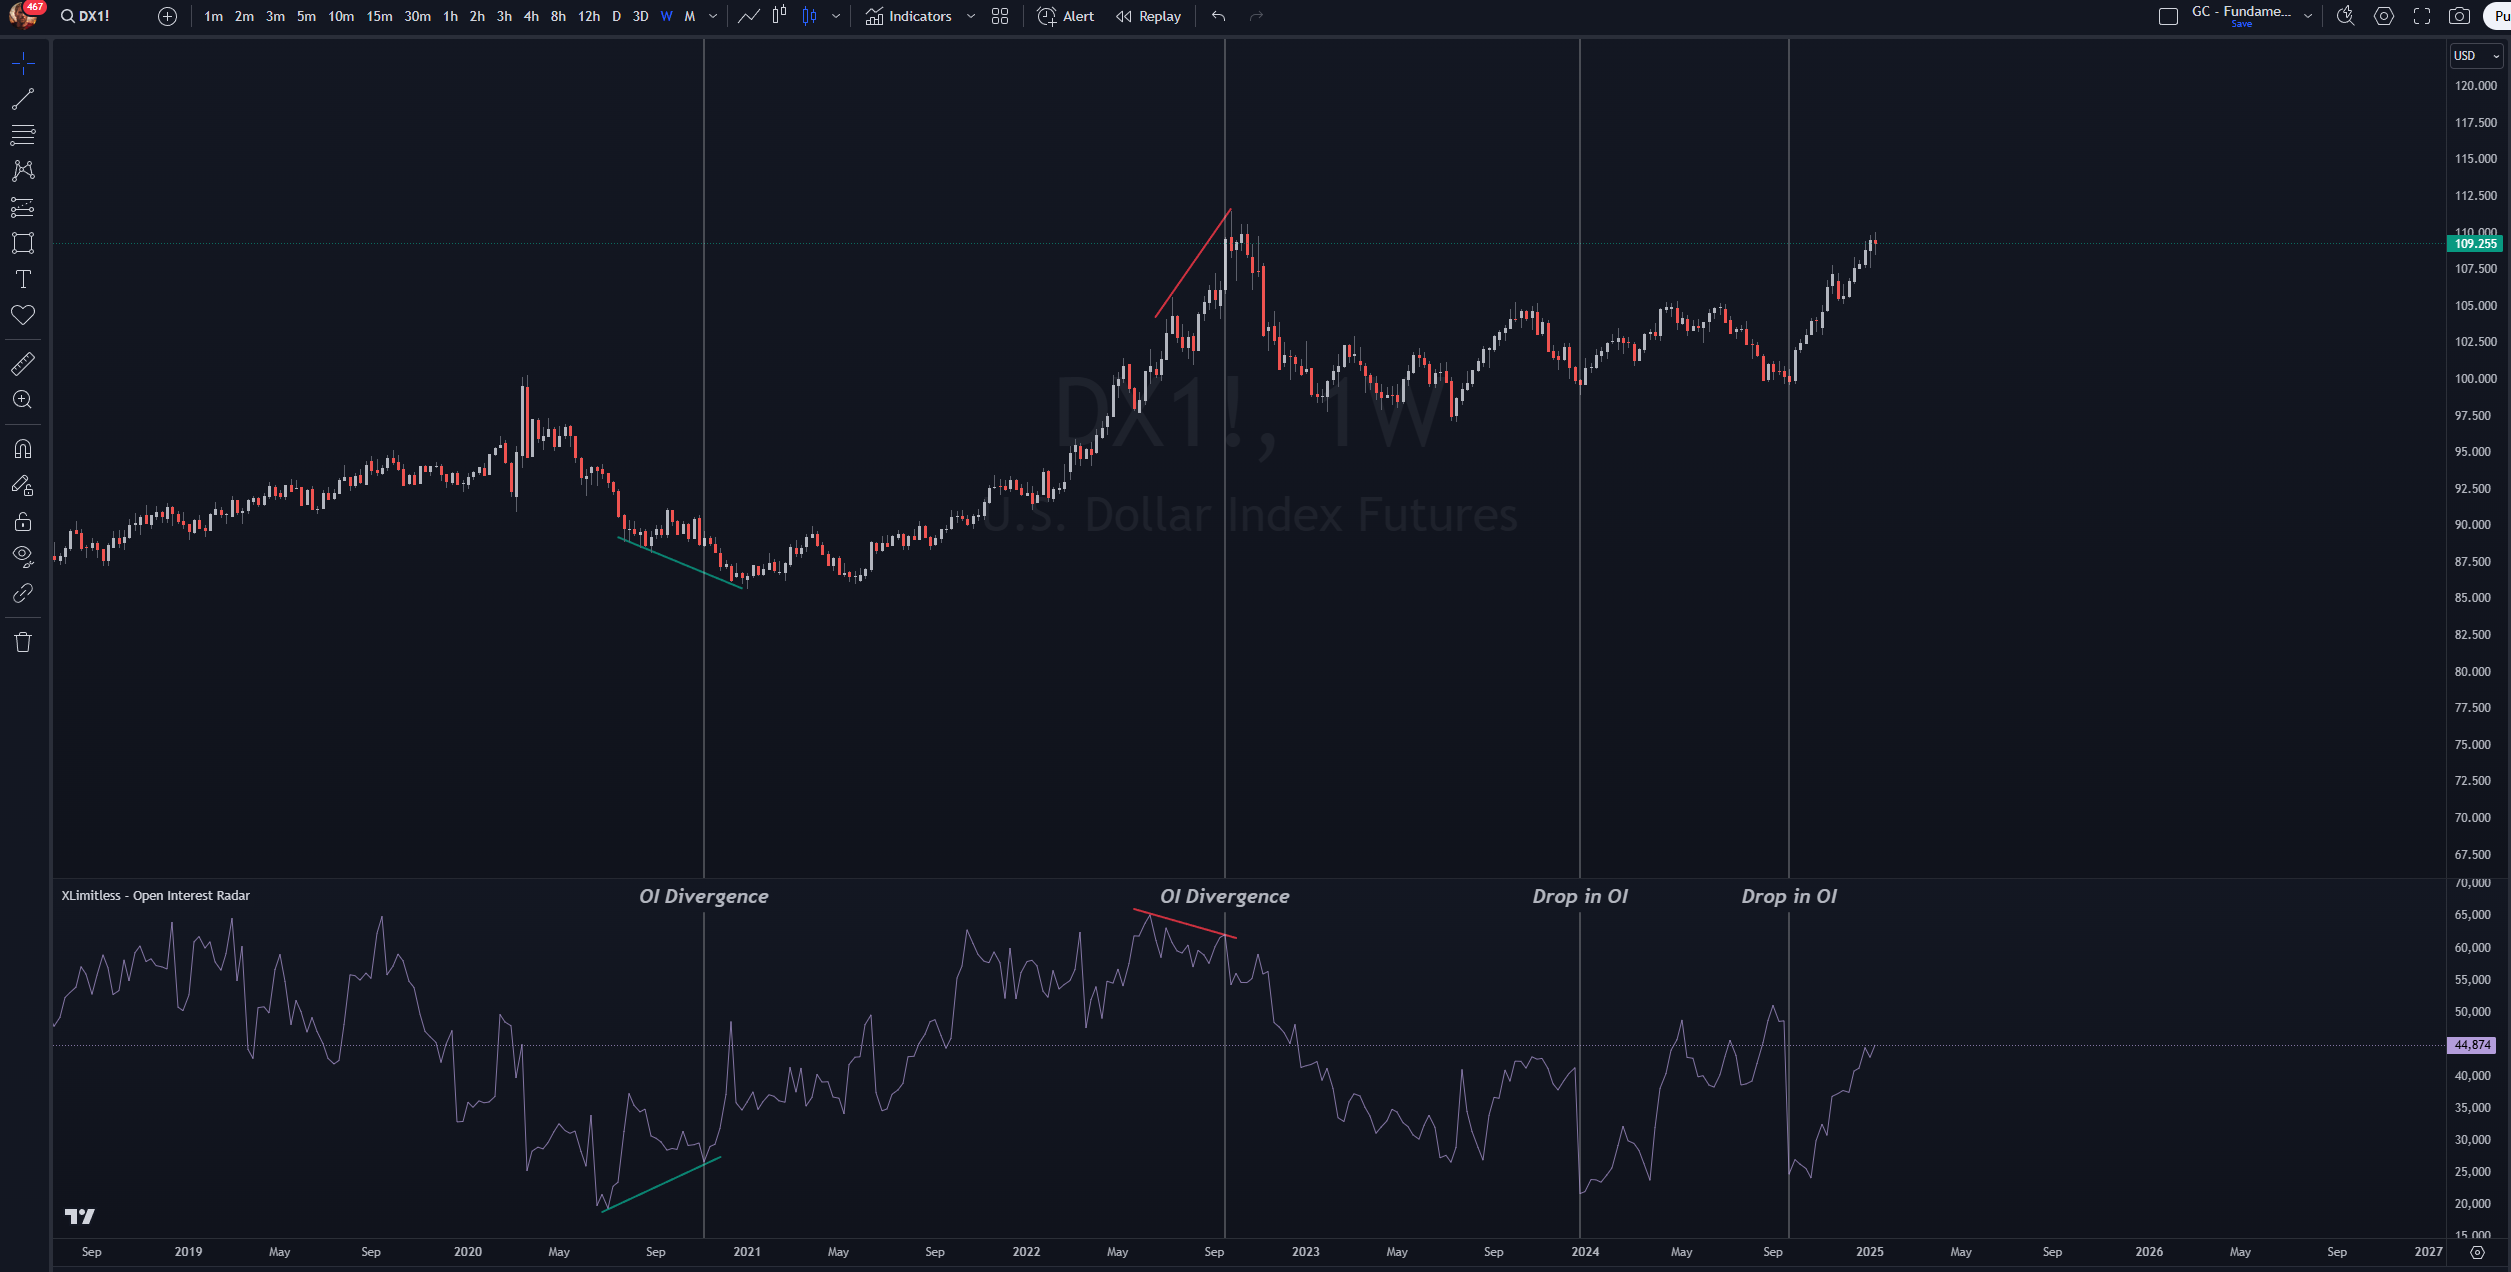
Catalysts for Open Interest (OI) Drops and When to Pay Attention:
1. Position Liquidation:
2. Contract Expiry:
3. Market Sentiment Shift:
4. Unexpected News or Events:
Additional Insight: Open Interest Drops in a Range-Bound Market
1. Why is my chart showing "No relevant data"?
2. Can I use this indicator for equities?
3. How often does the data update?
4. Can I use this on the Daily Timeframe?
Disclaimer
The Open Interest Radar is a tool designed to provide insights into market participation by tracking Open Interest levels; however, it does not guarantee accurate predictions of market behavior. Trading involves significant risk, and Open Interest trends should be used as part of a broader analysis that includes other indicators and market factors. The data is based on historical information, which may not account for unexpected market events or future conditions. Always perform your own due diligence and consult with a financial professional before making trading decisions. The user assumes full responsibility for their actions and any associated risks.
