
Documentation

Quickstart

Use Smart Money Intelligence™ (SMI) to follow hedge funds, commercial flows, and retail sentiment. When smart money and dumb money are at opposite extremes, you’ll know - so you can trade like an insider.

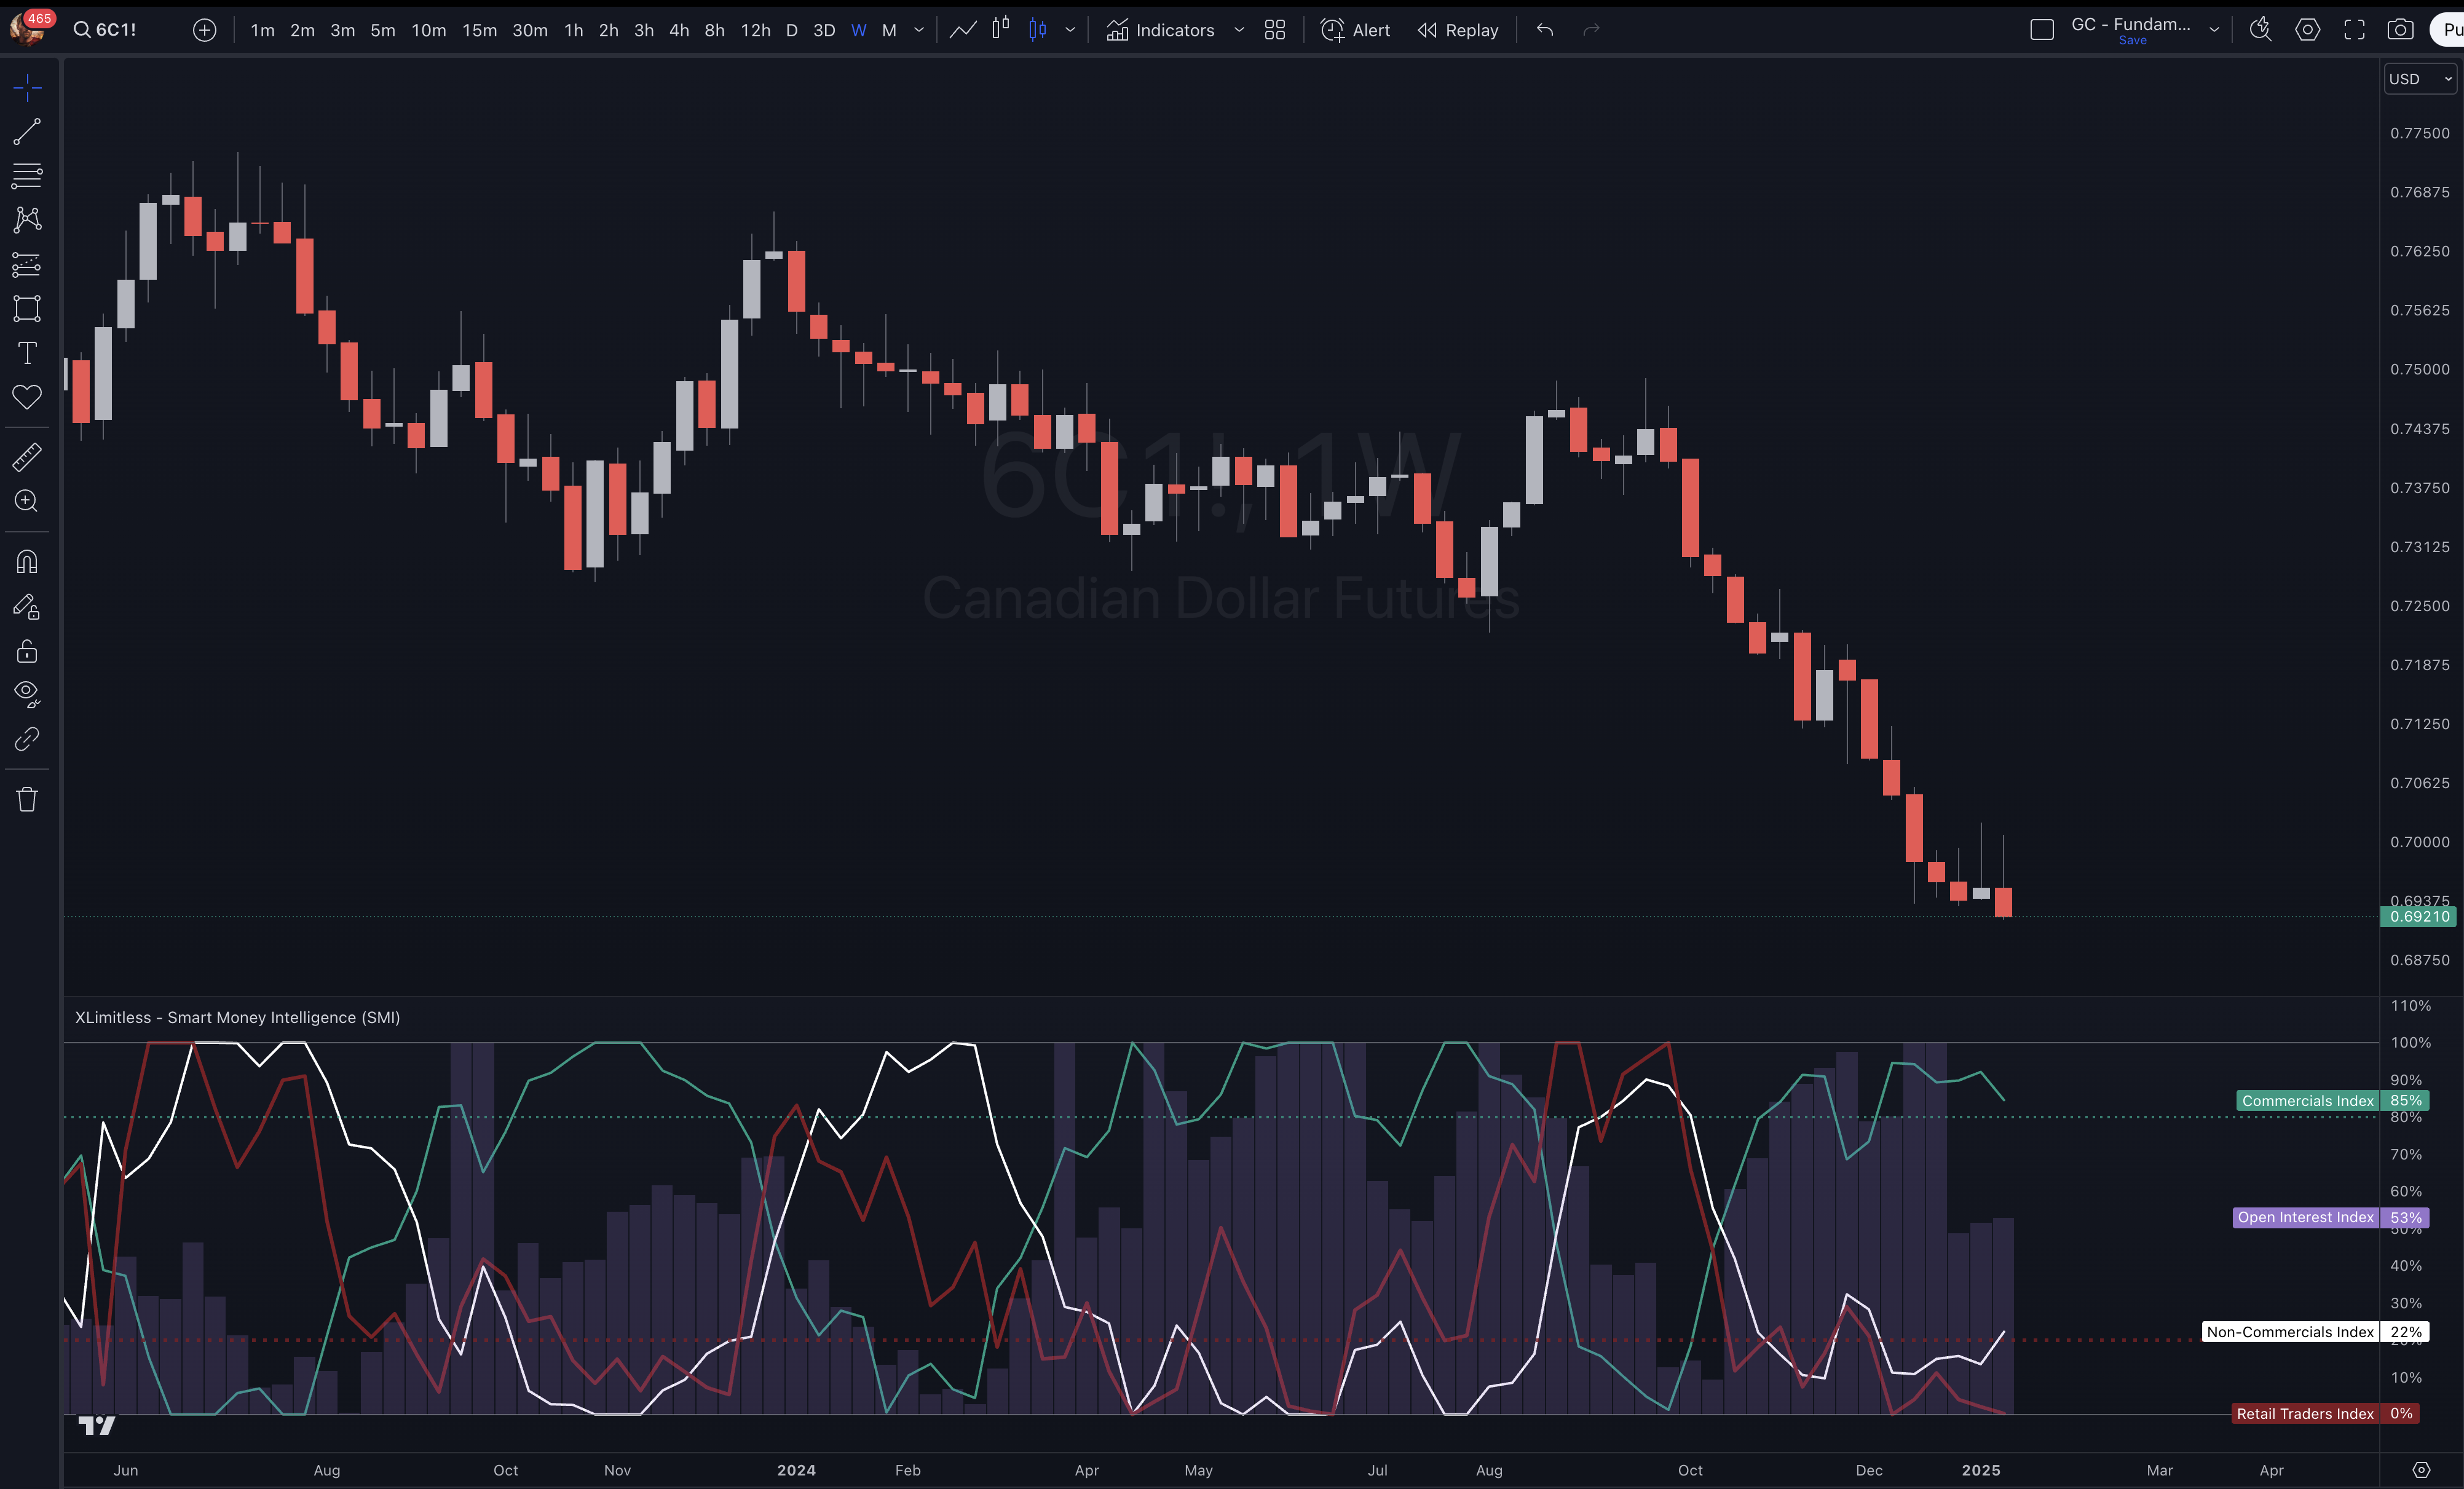
The "X Limitless - Smart Money Intelligence (SMI)" indicator is designed to provide traders with detailed insights into market dynamics by tracking extreme positioning and open interest across various participant groups, including Commercials, Non-Commercials, and Retail Traders. The indicator is built to normalize and visualize these metrics, enabling informed decision-making gauging the market sentiment.
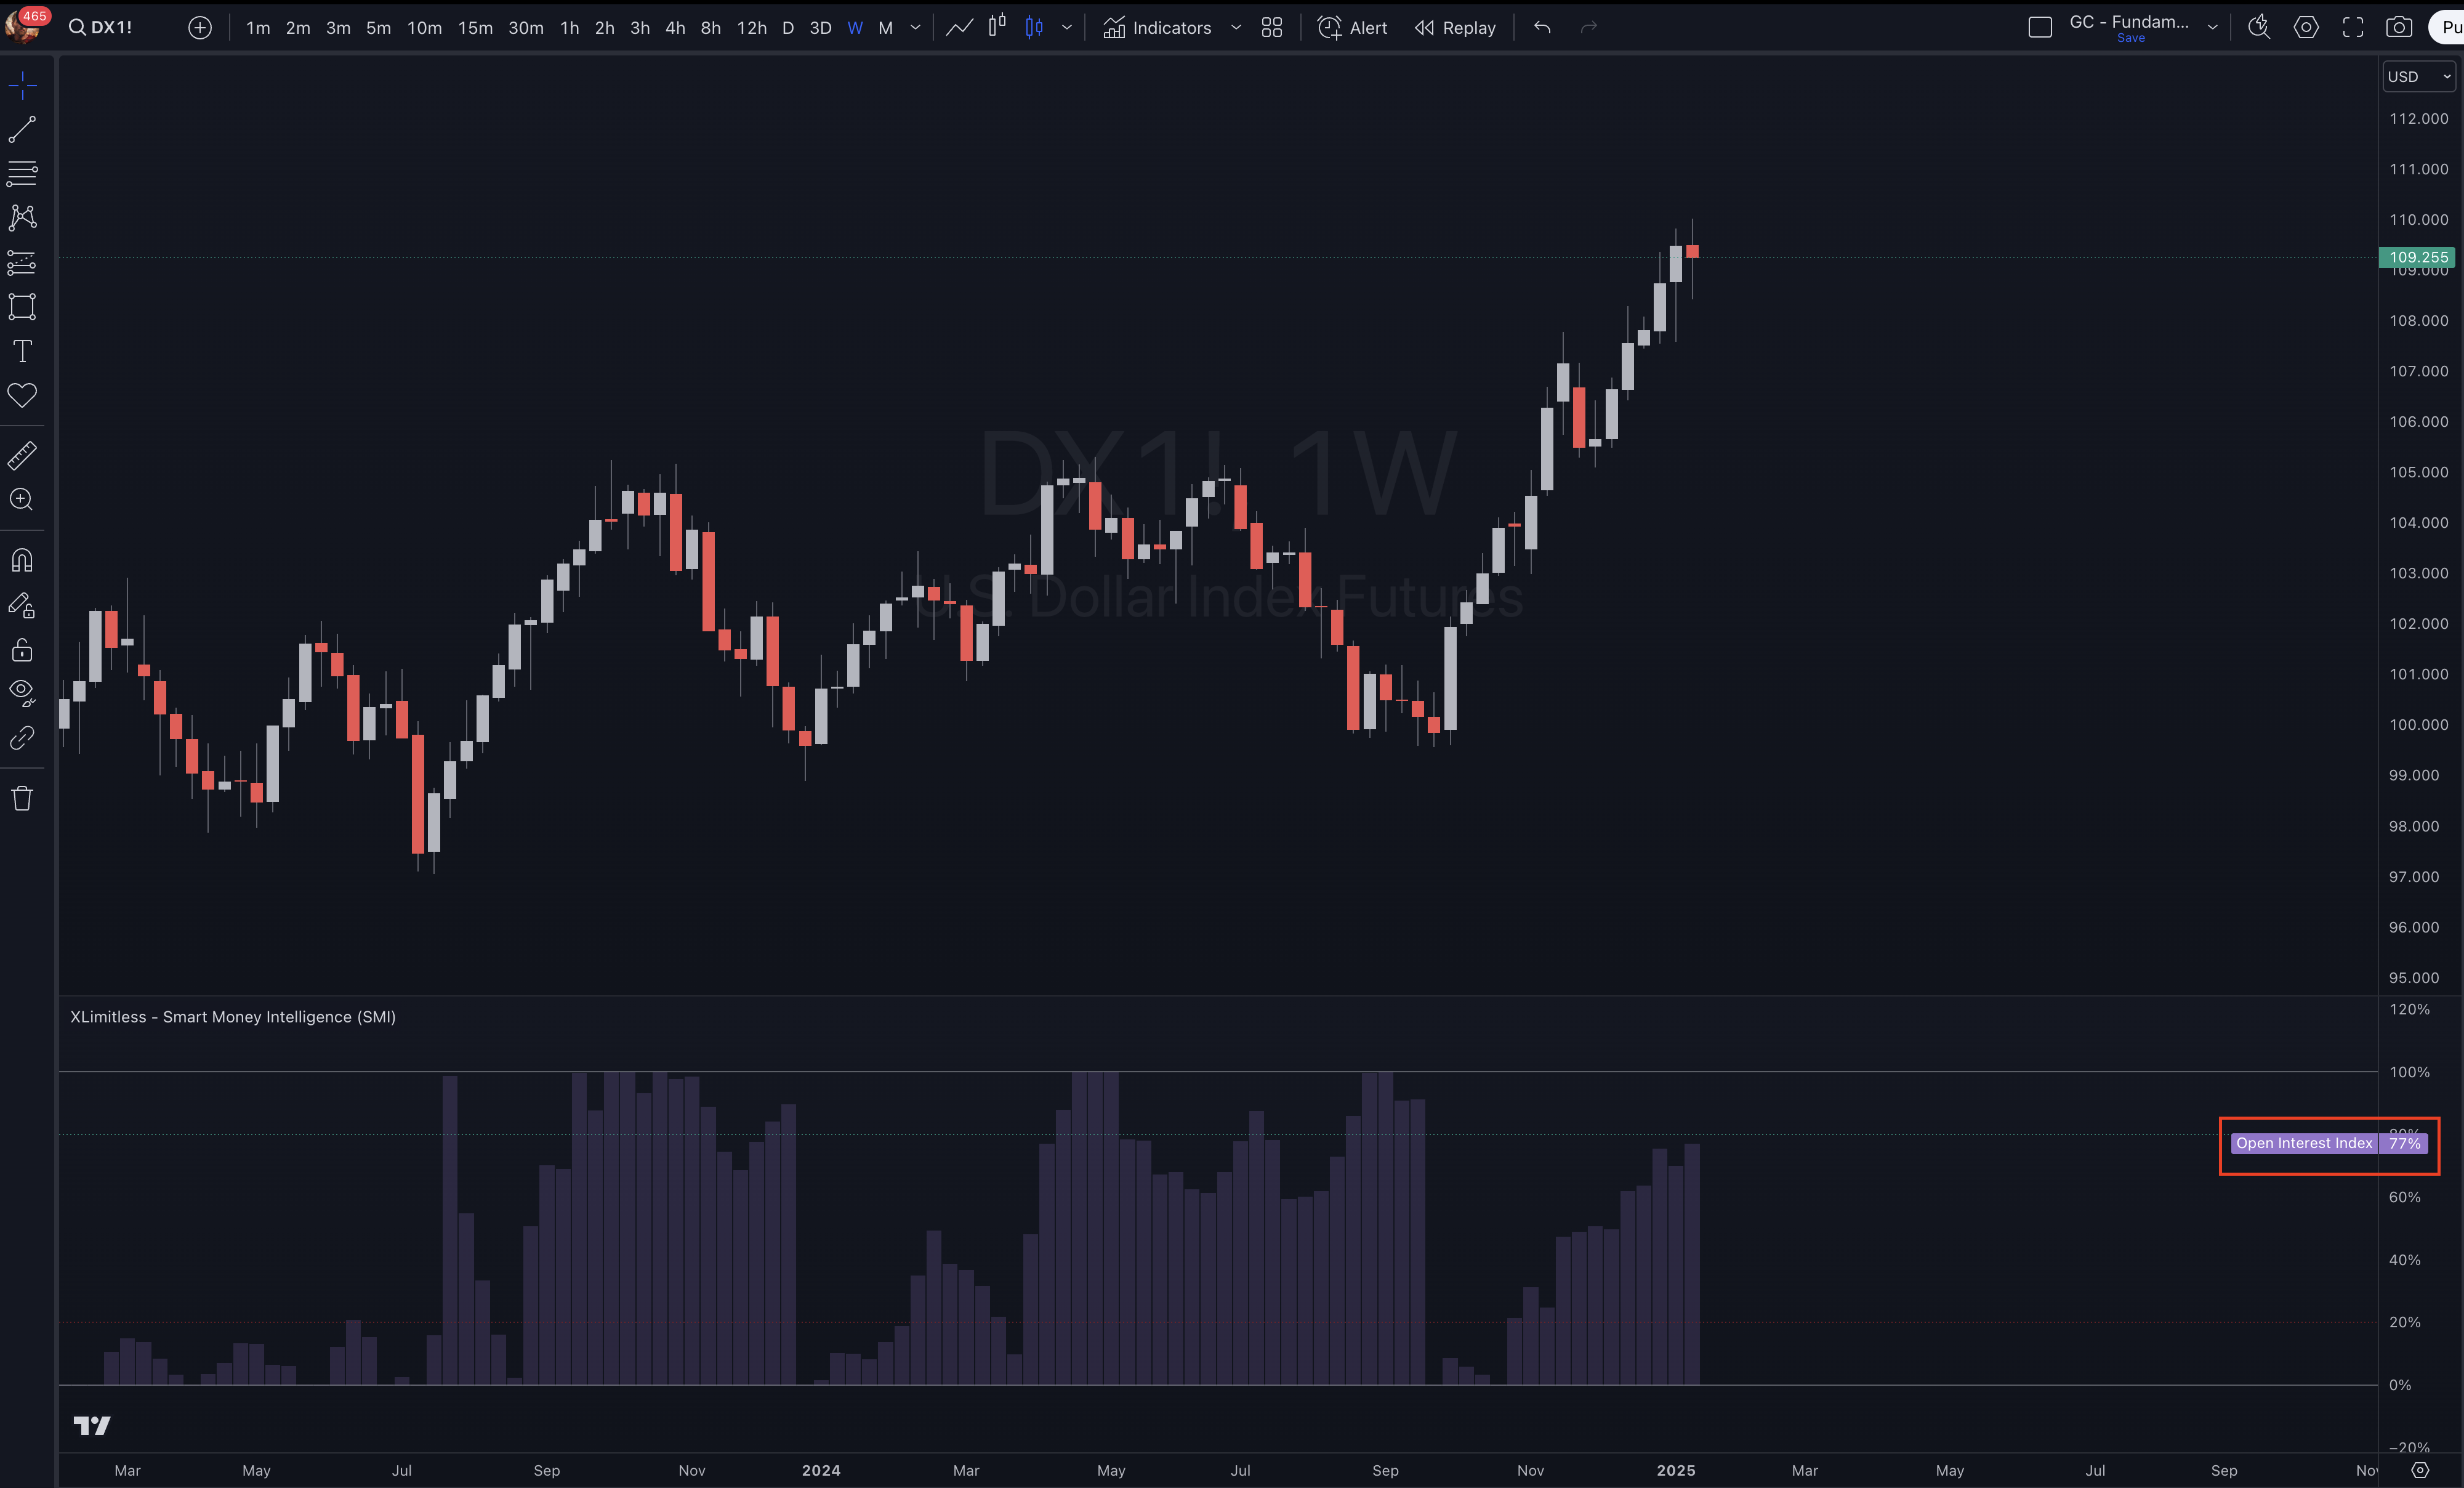
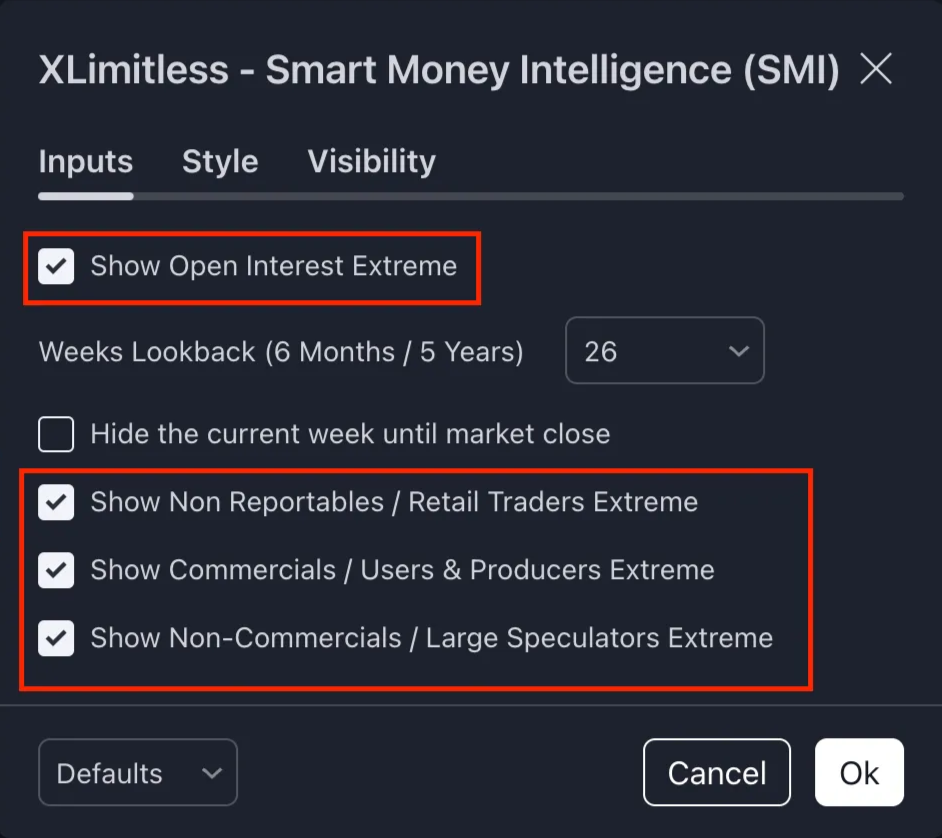
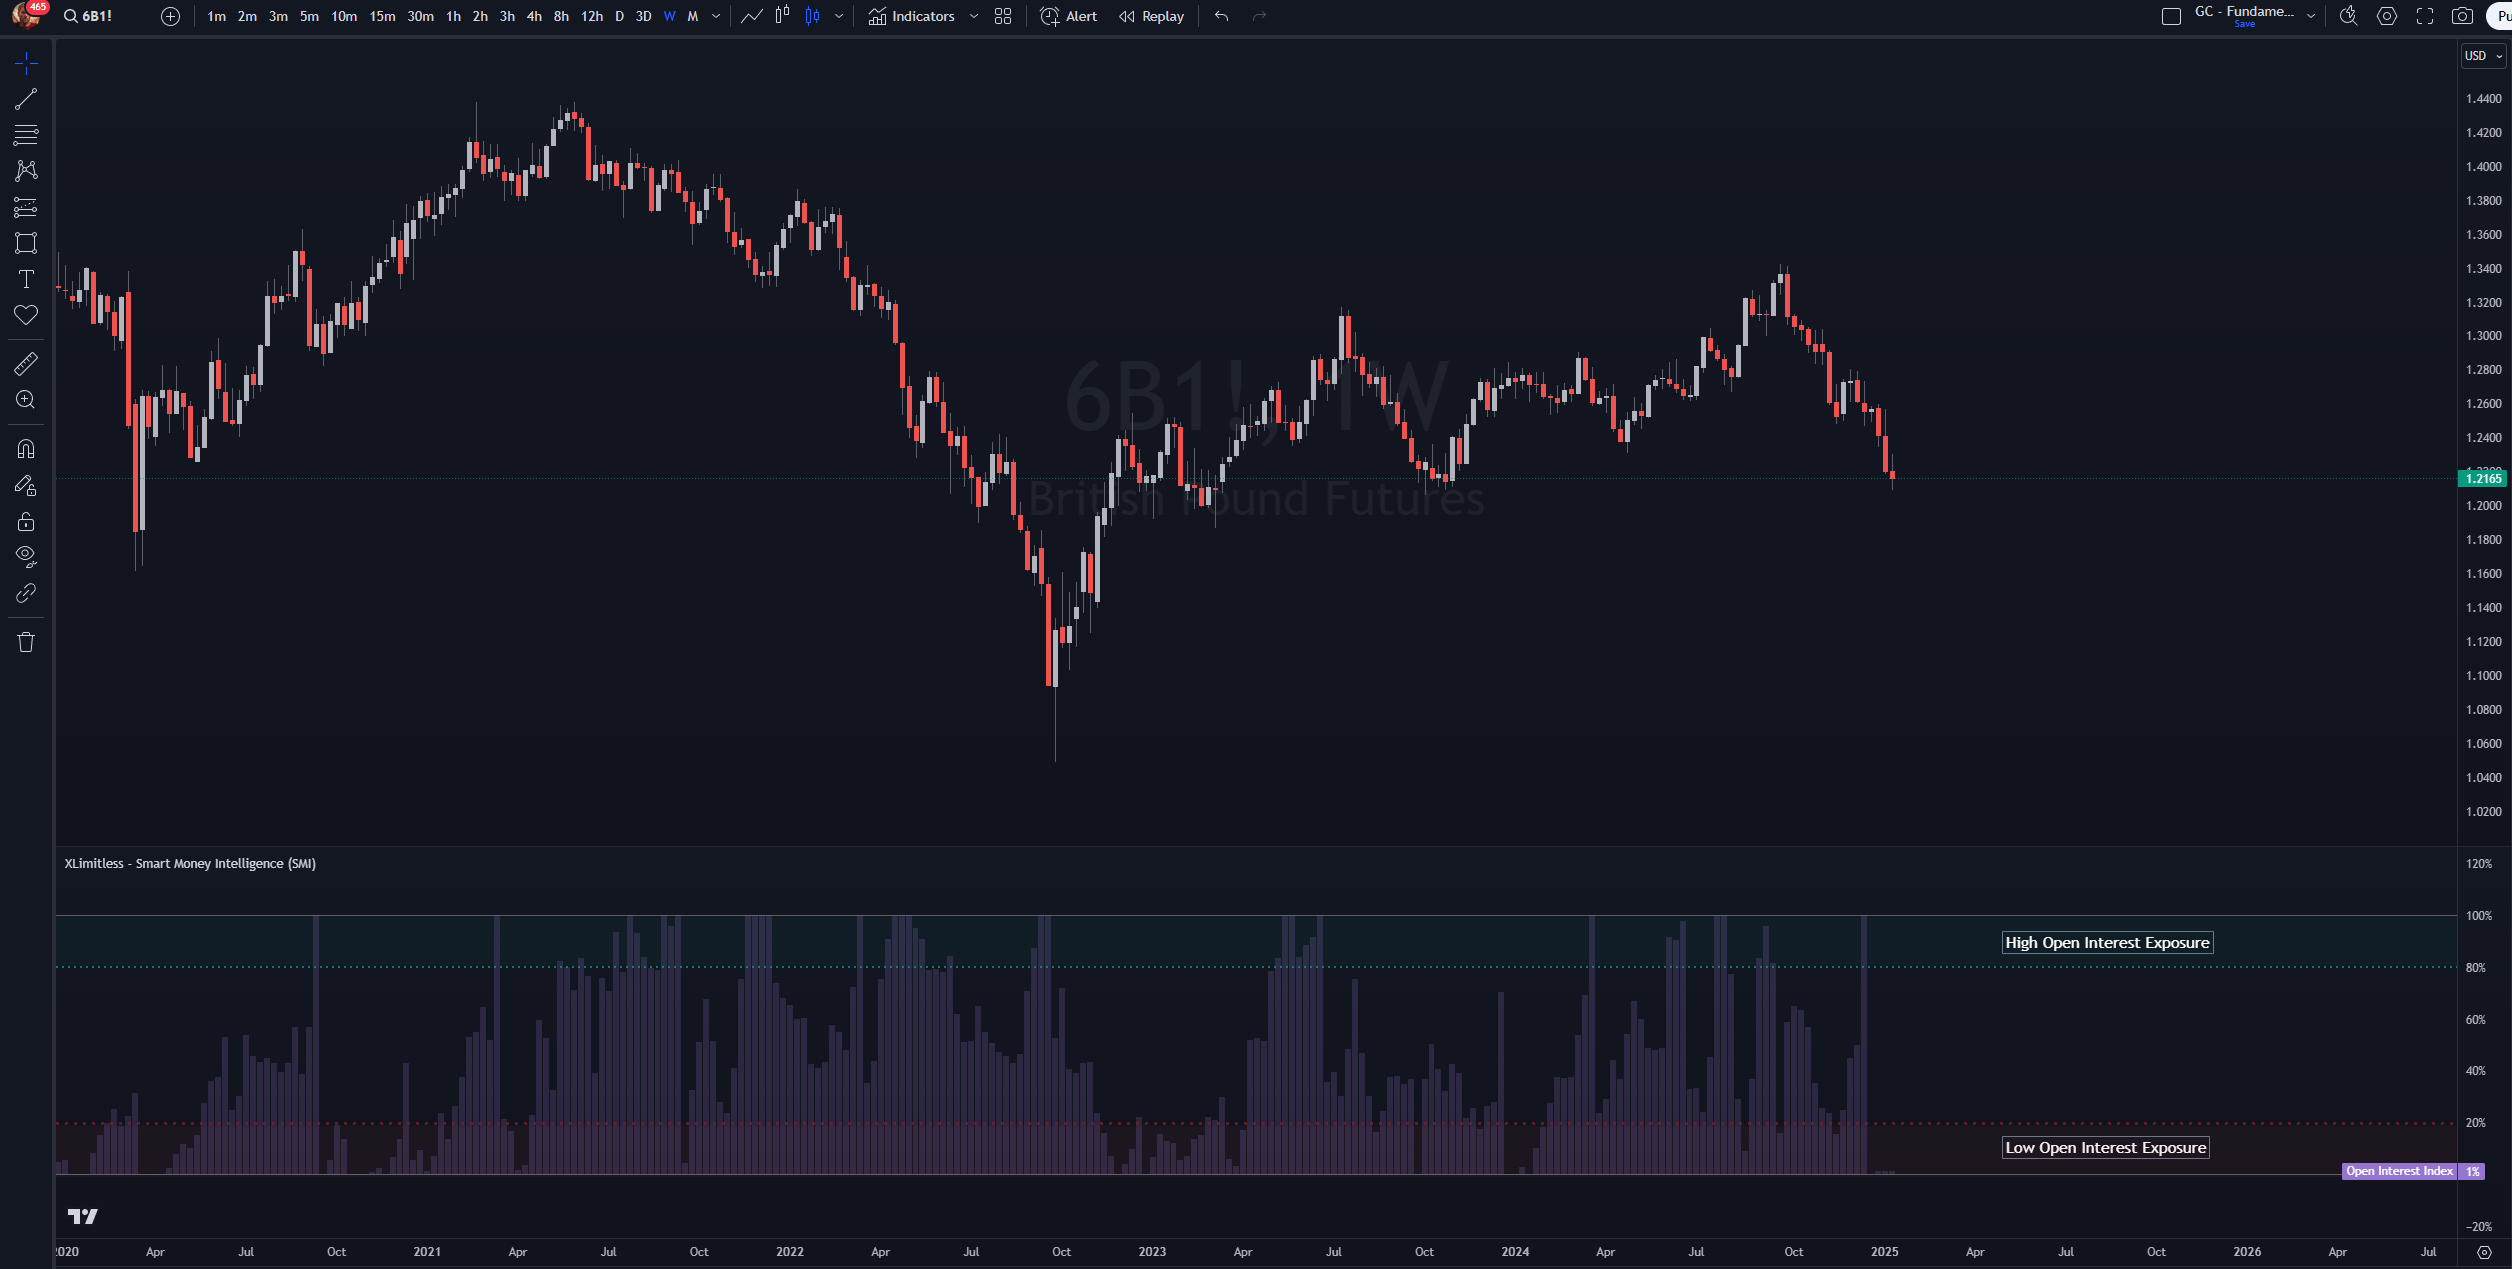
1. Open Interest Extremes
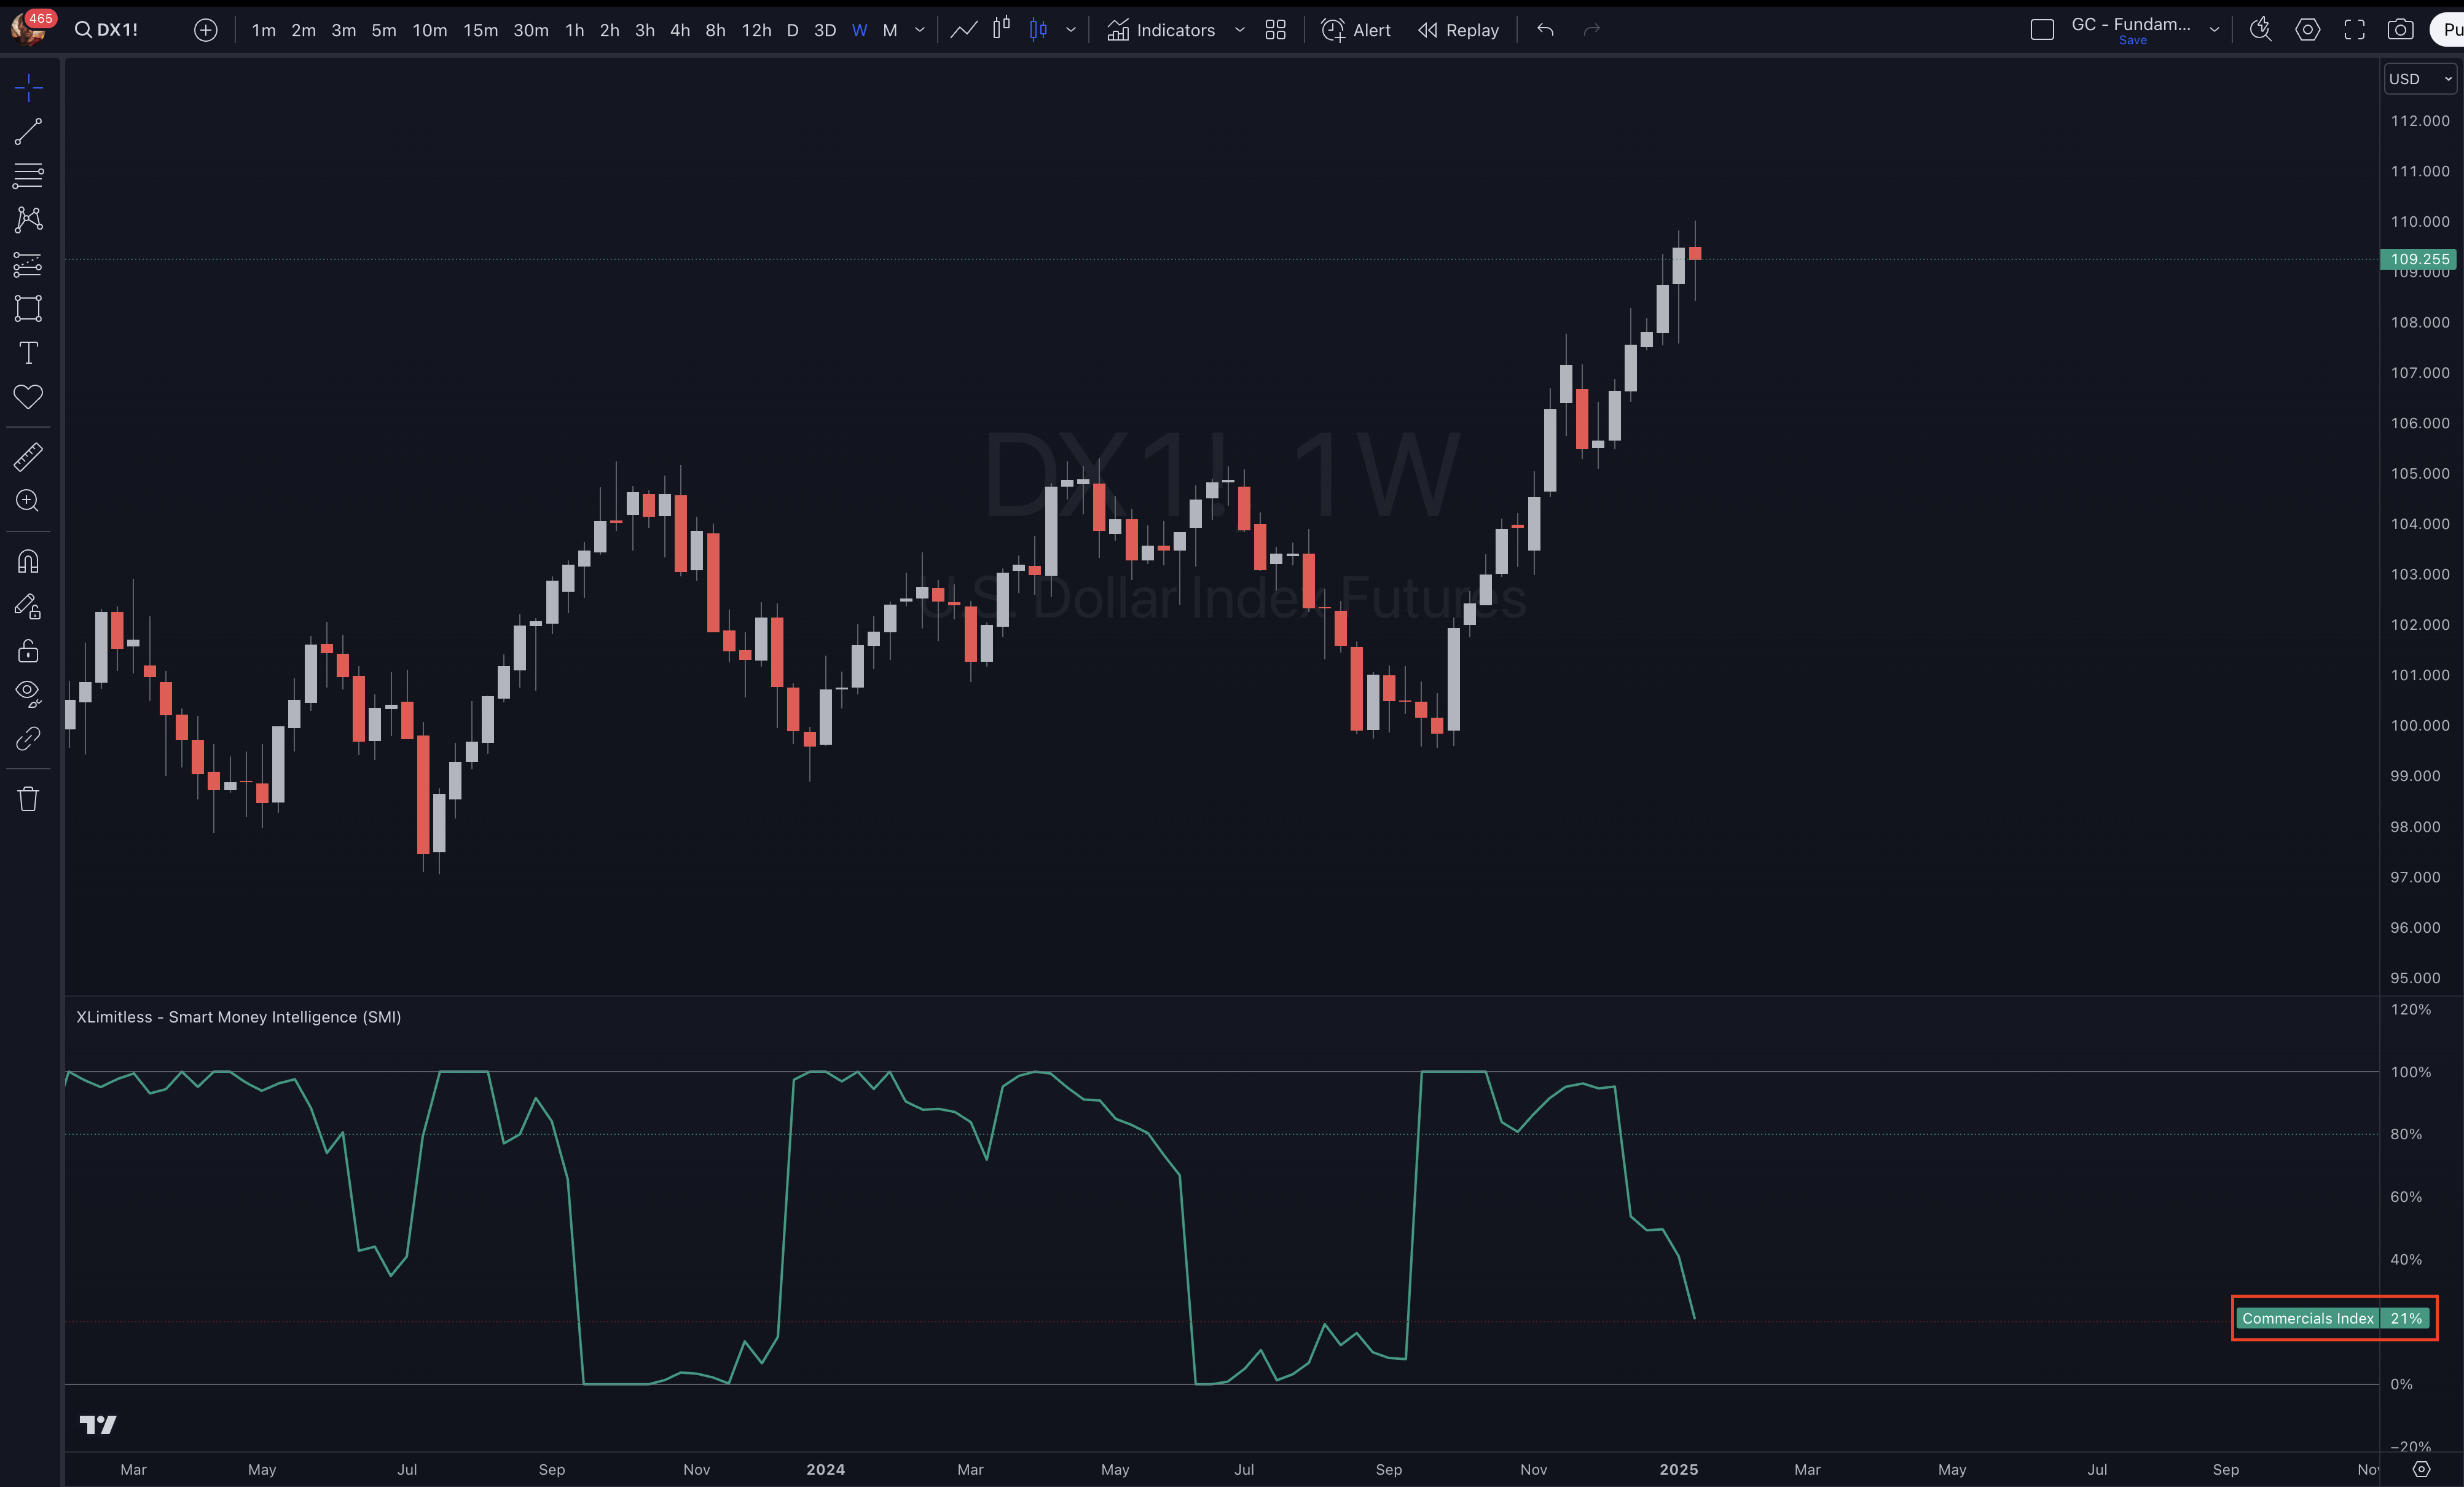
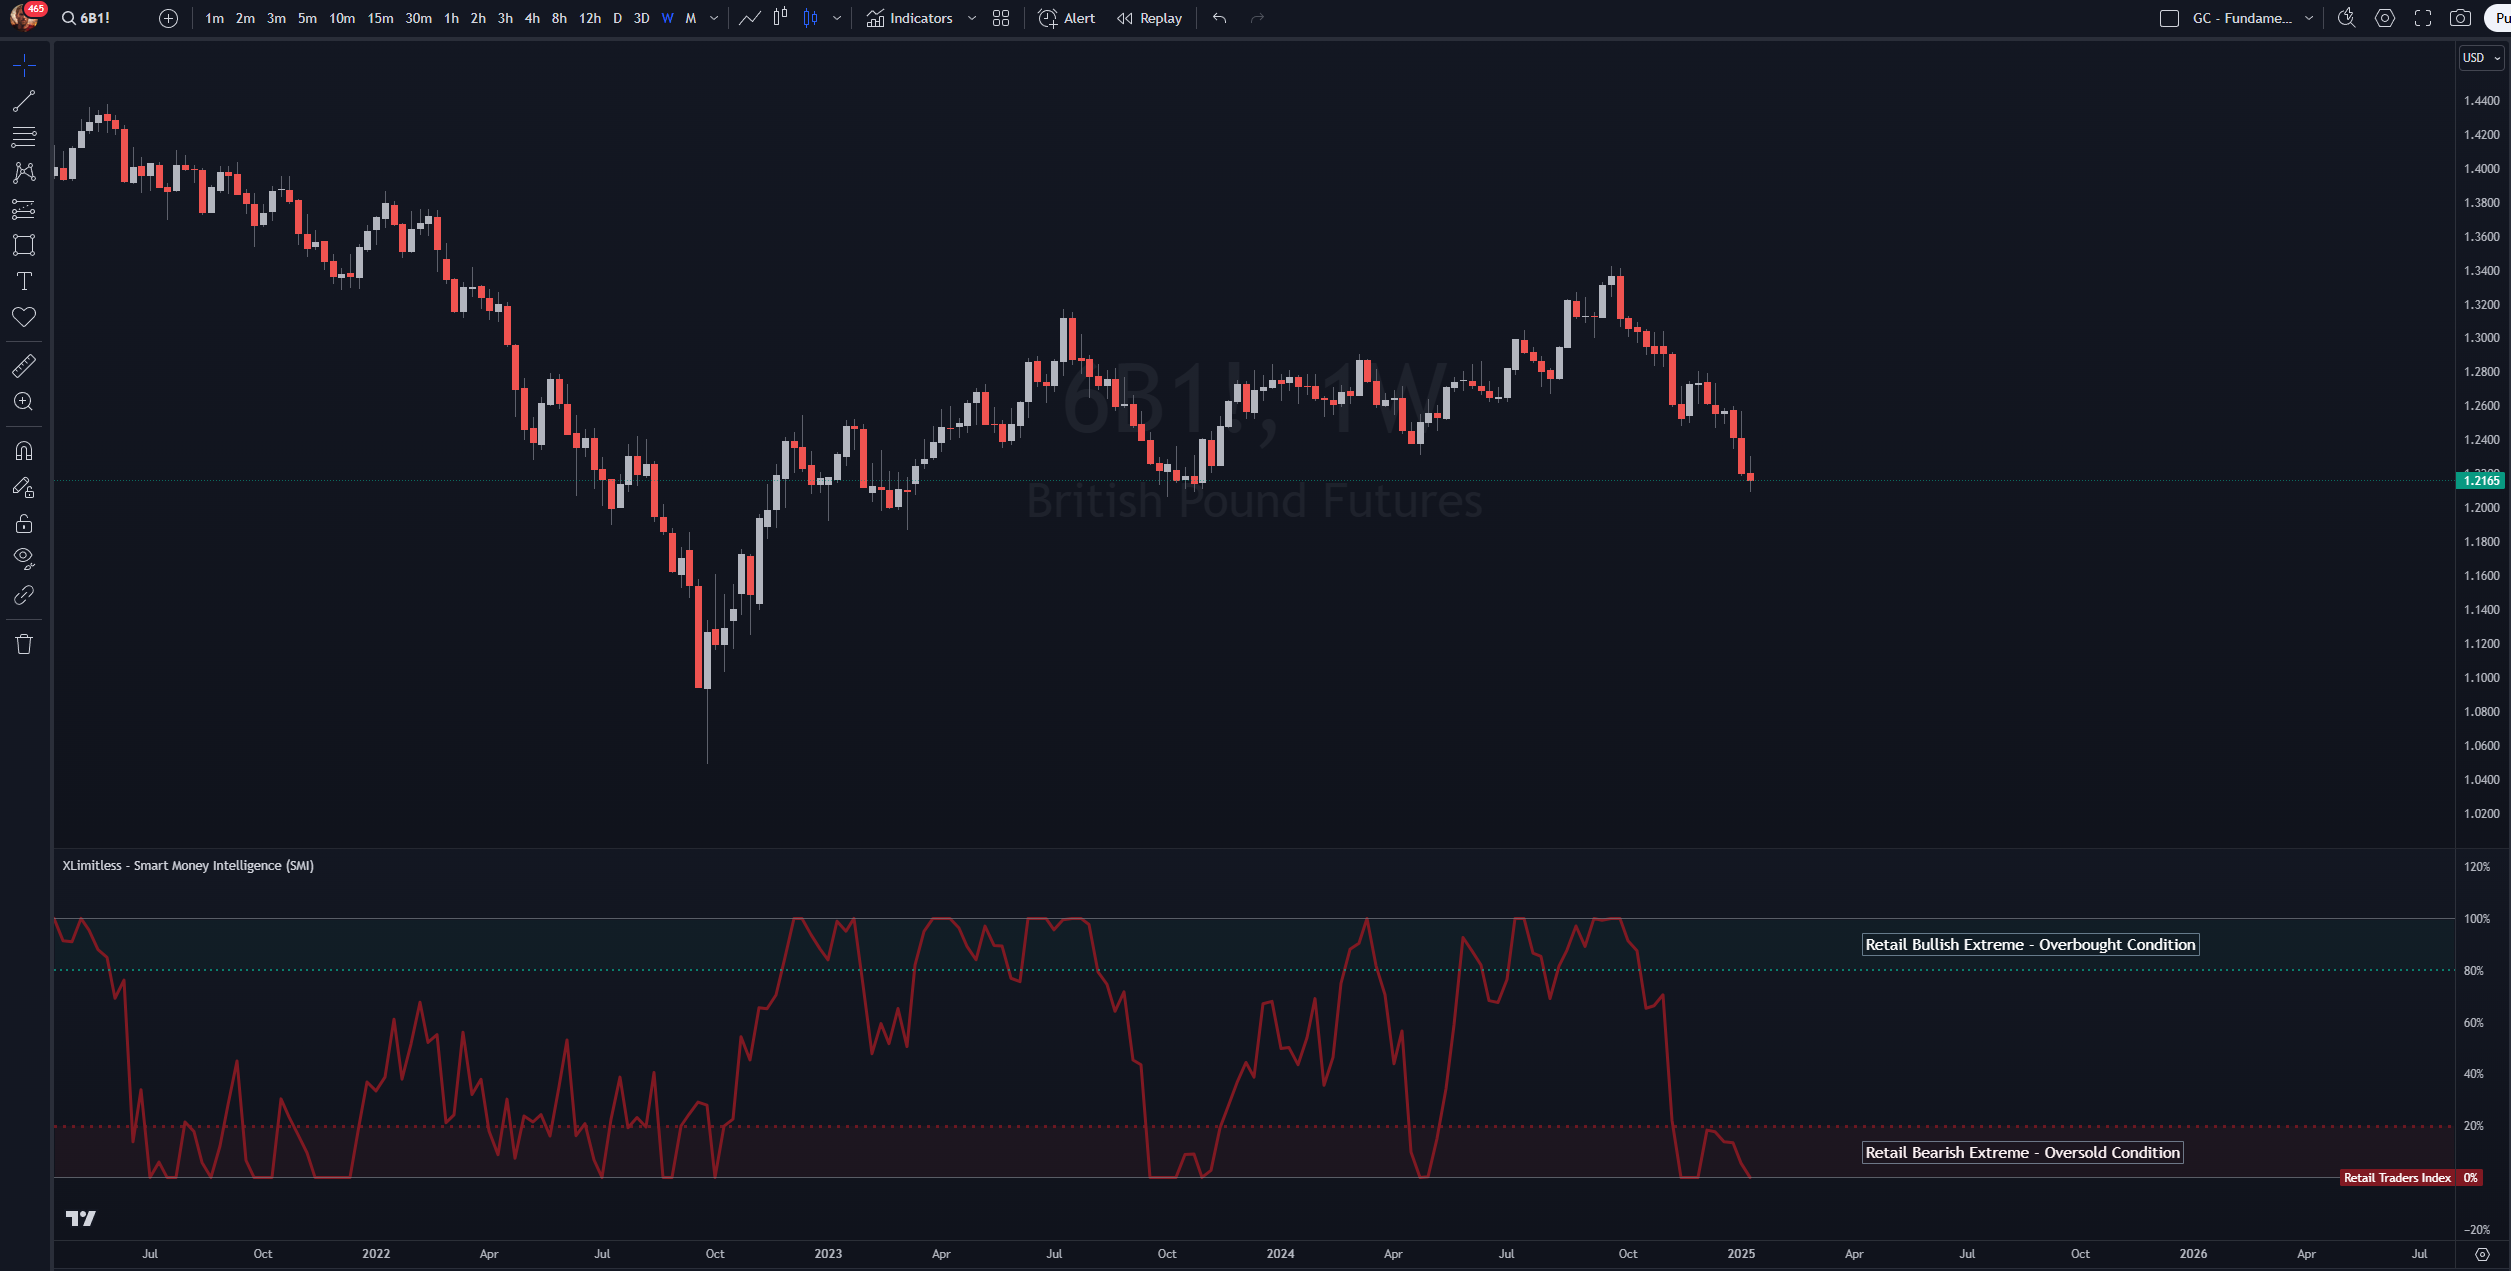
2. Participant Extremes
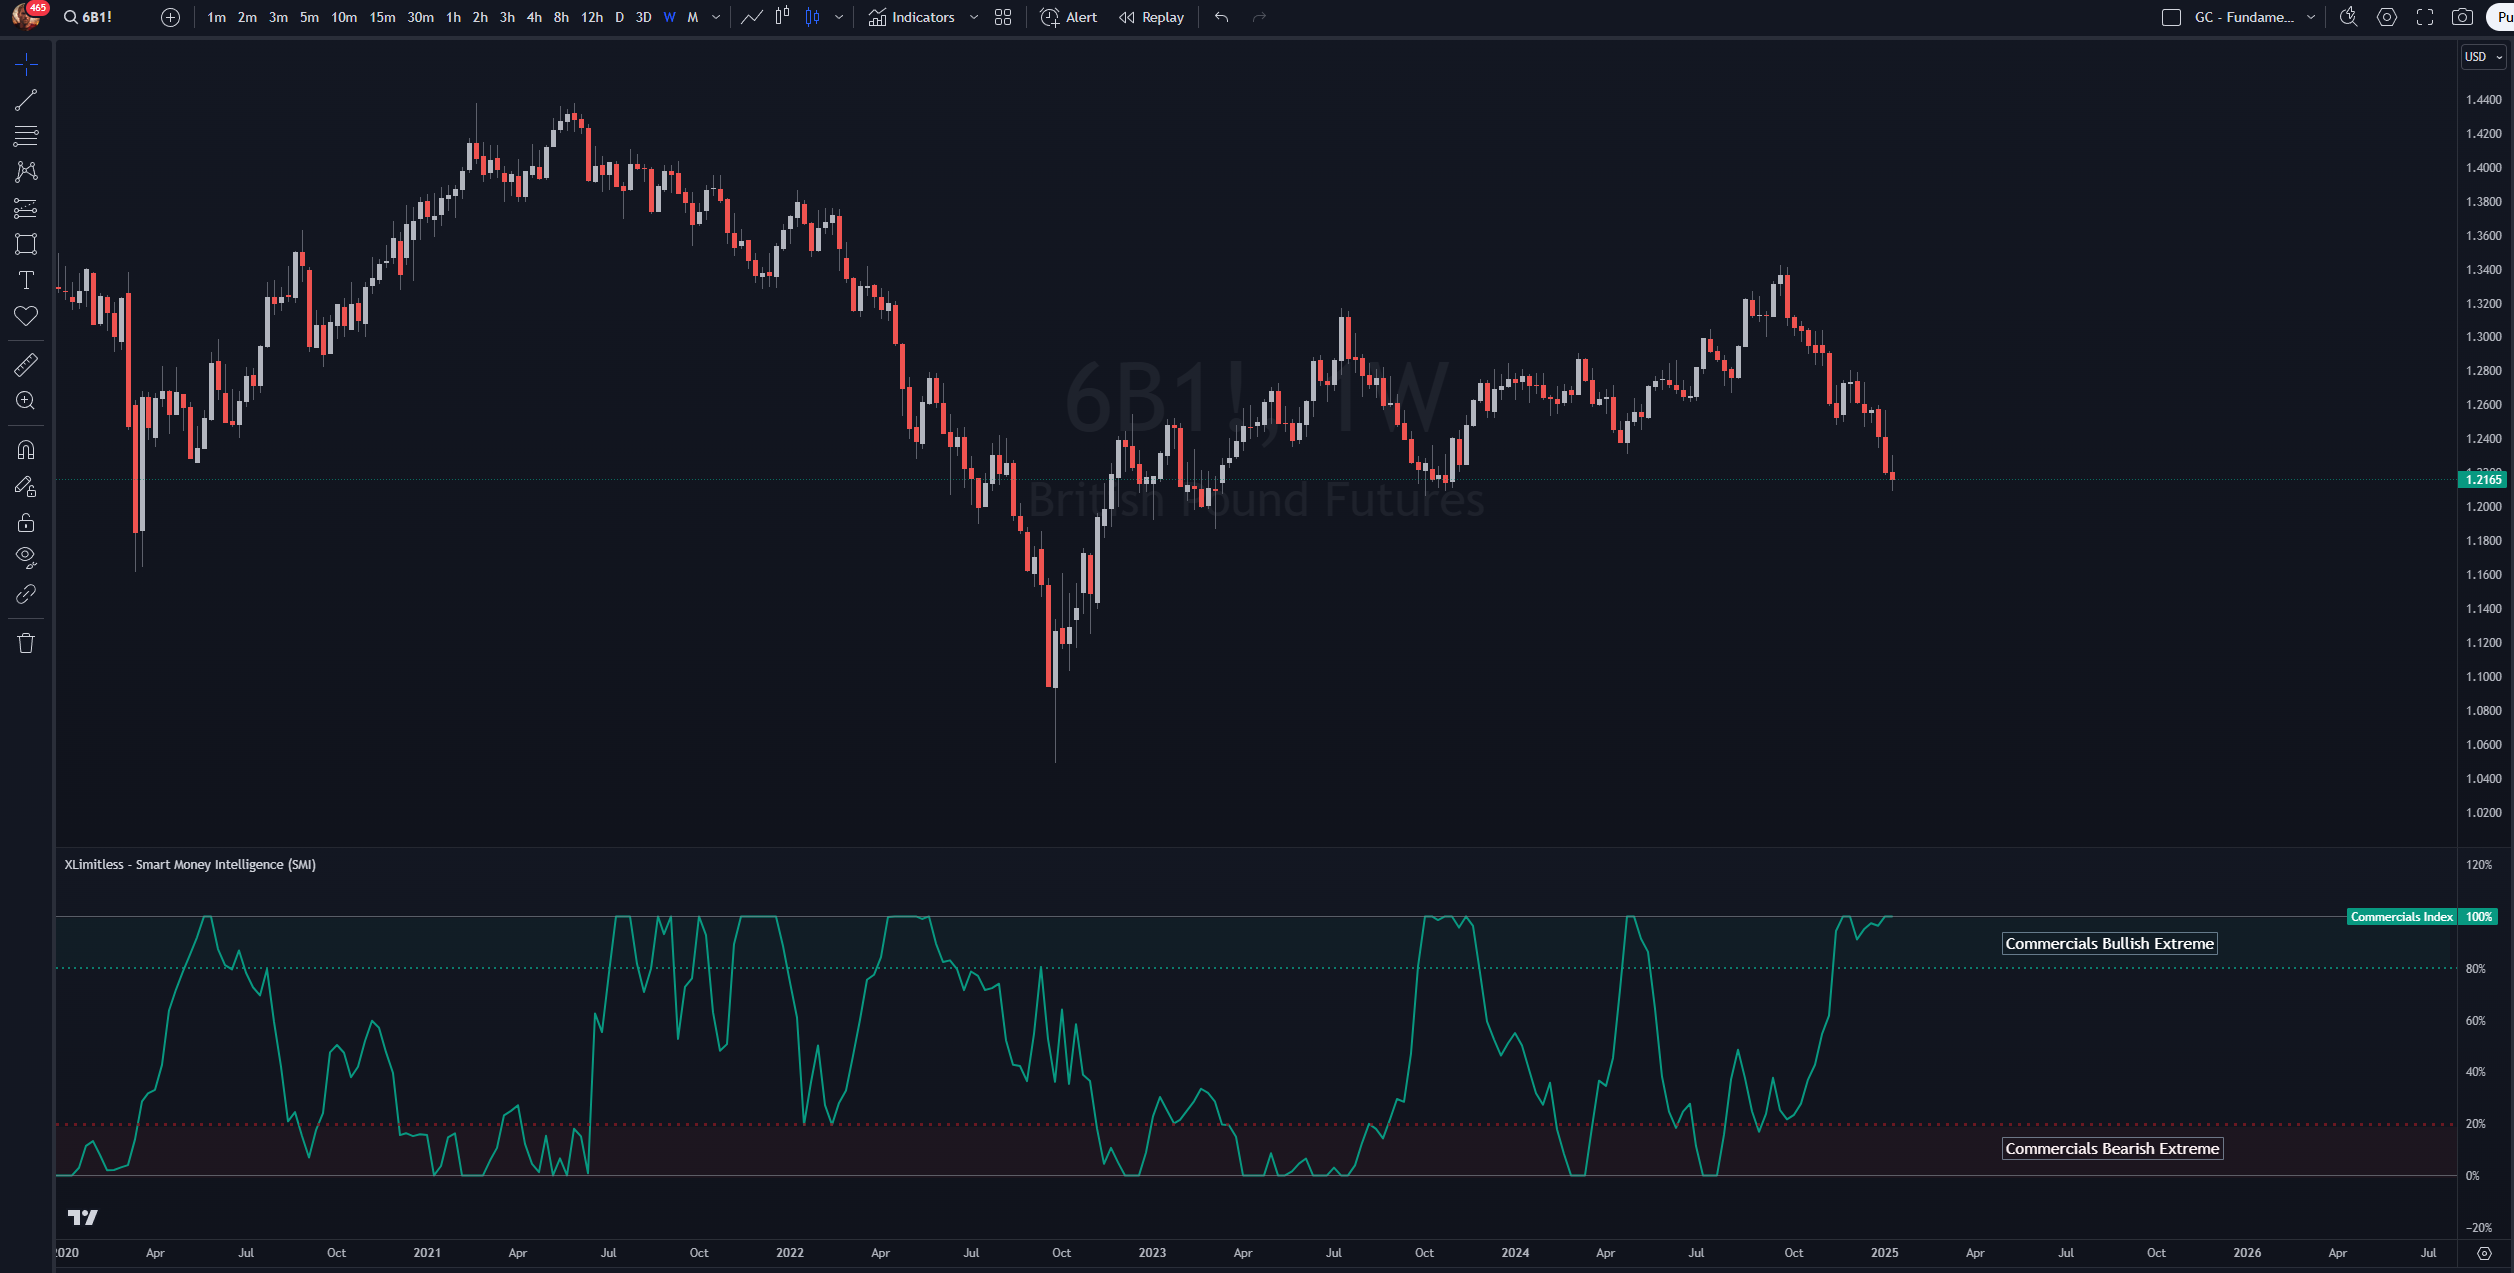
Tracks Commercials (Users & Producers, Hedgers).
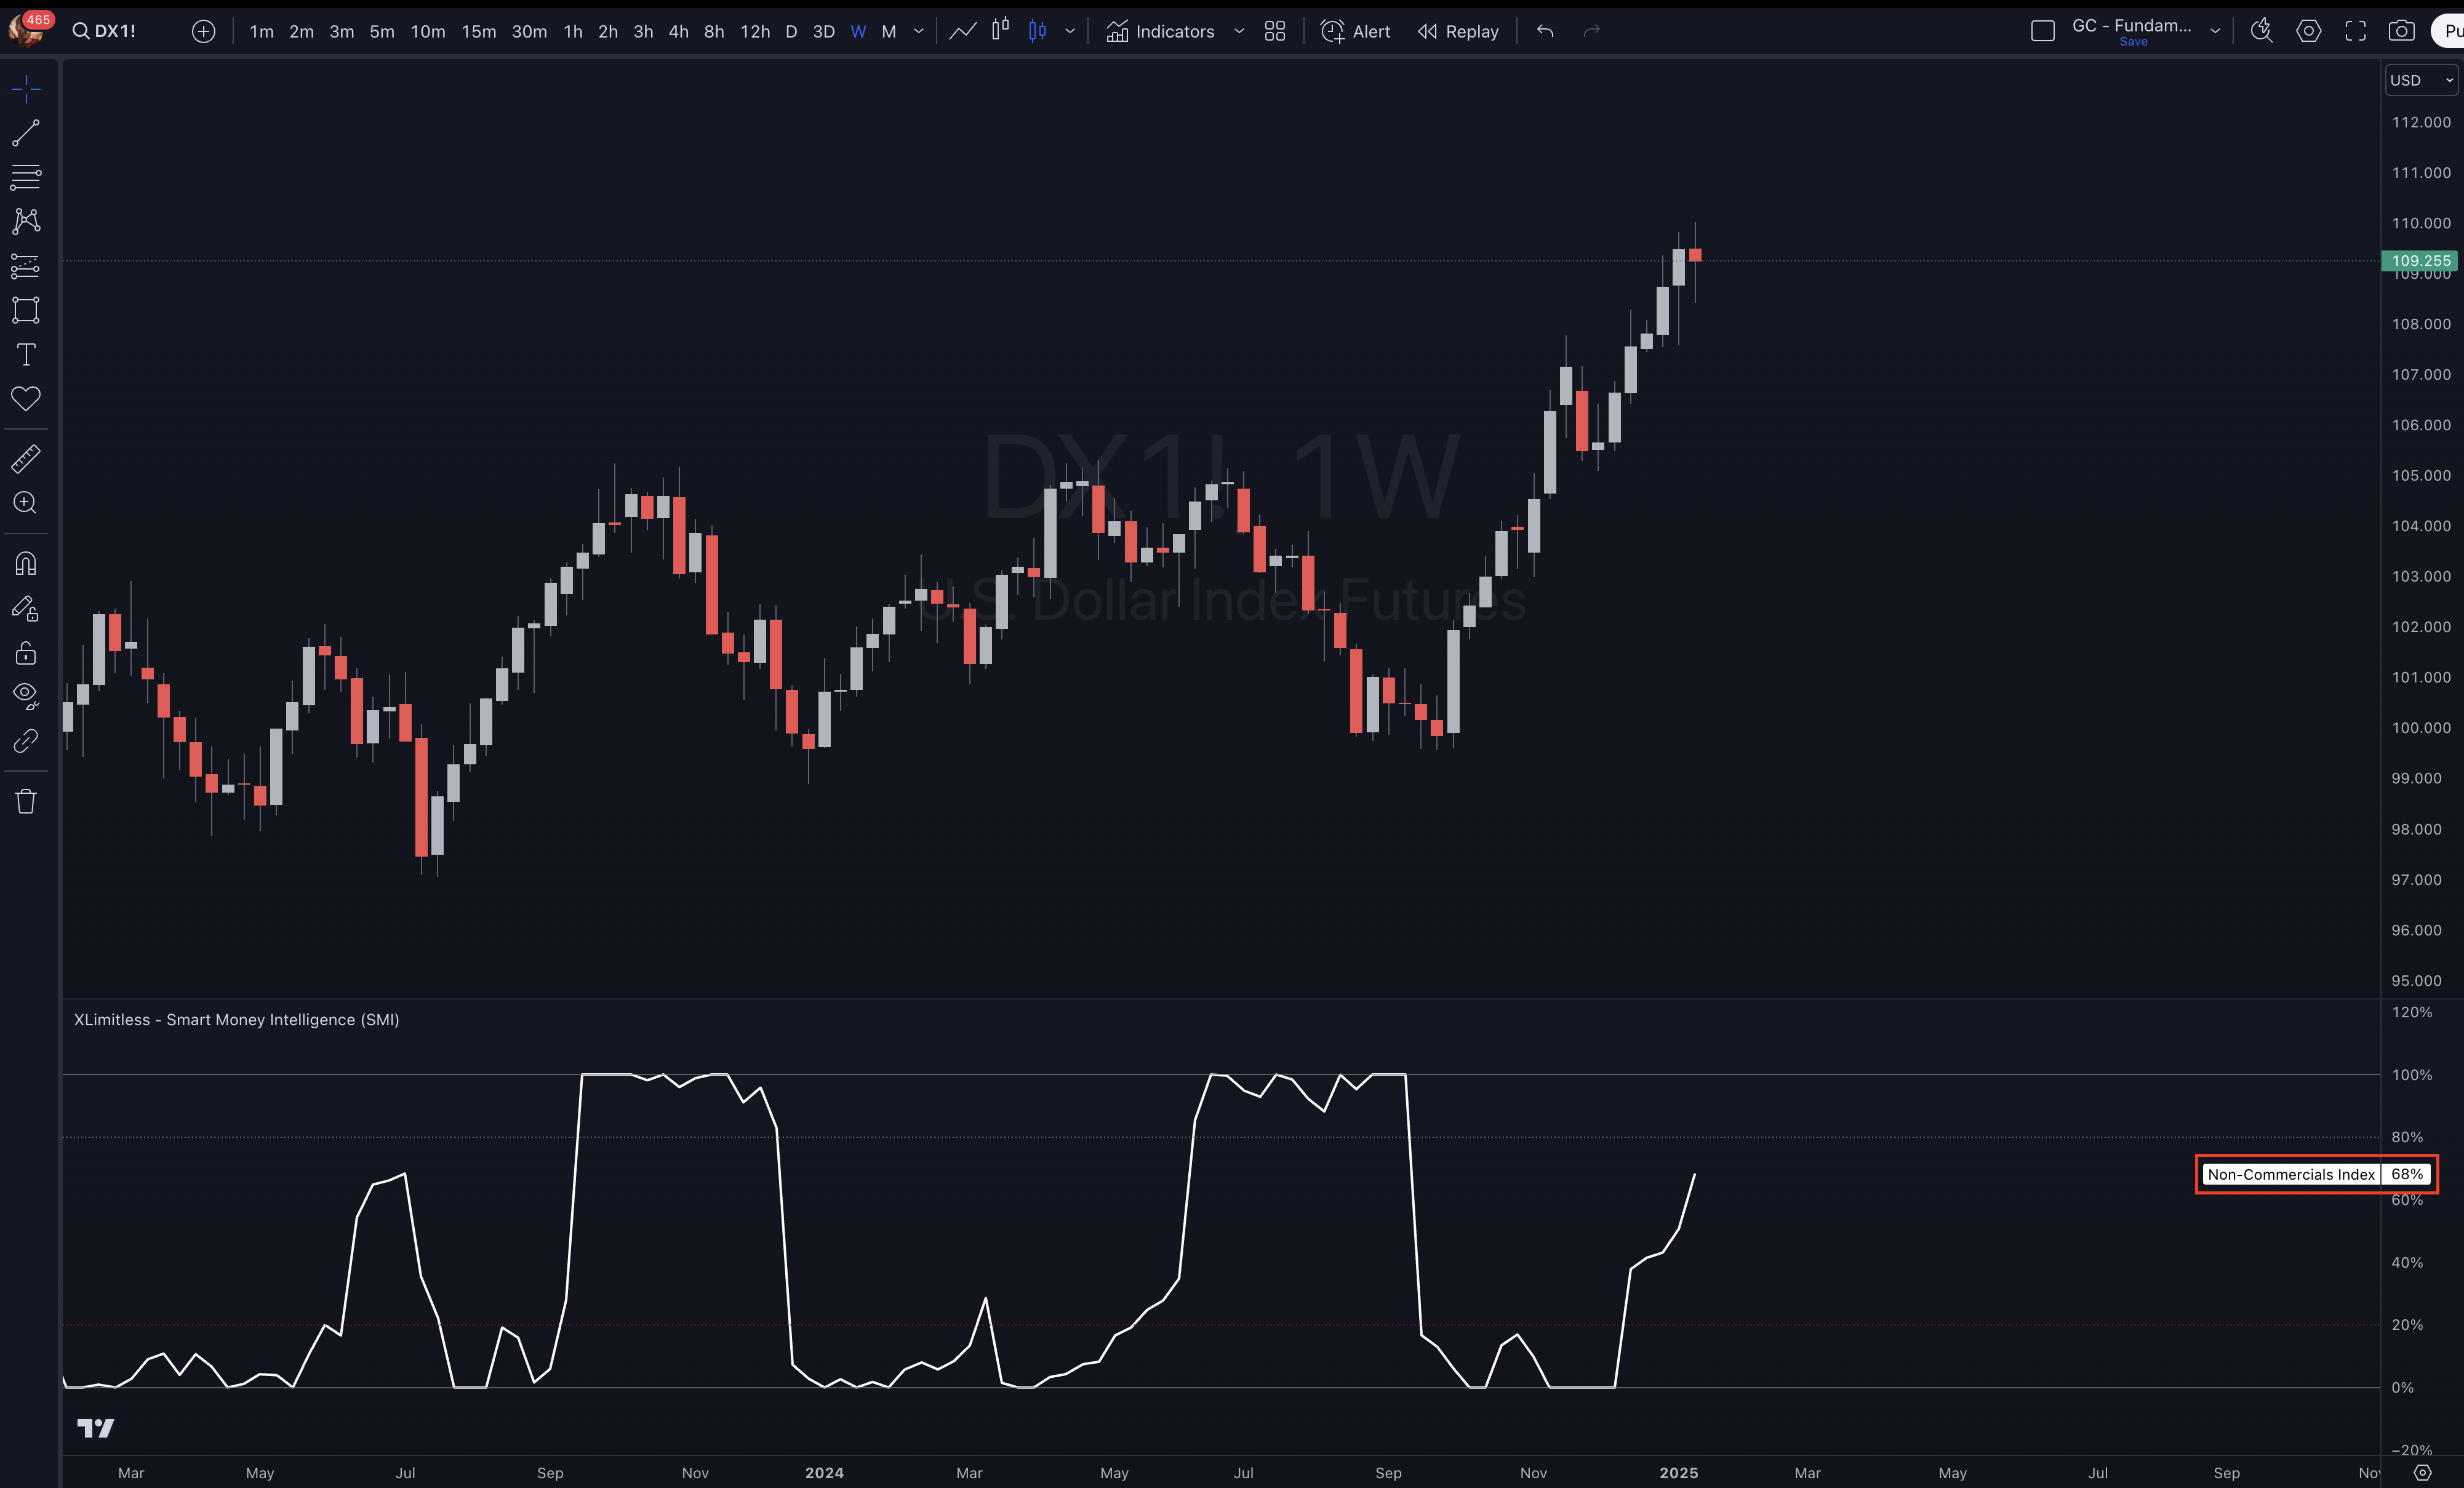
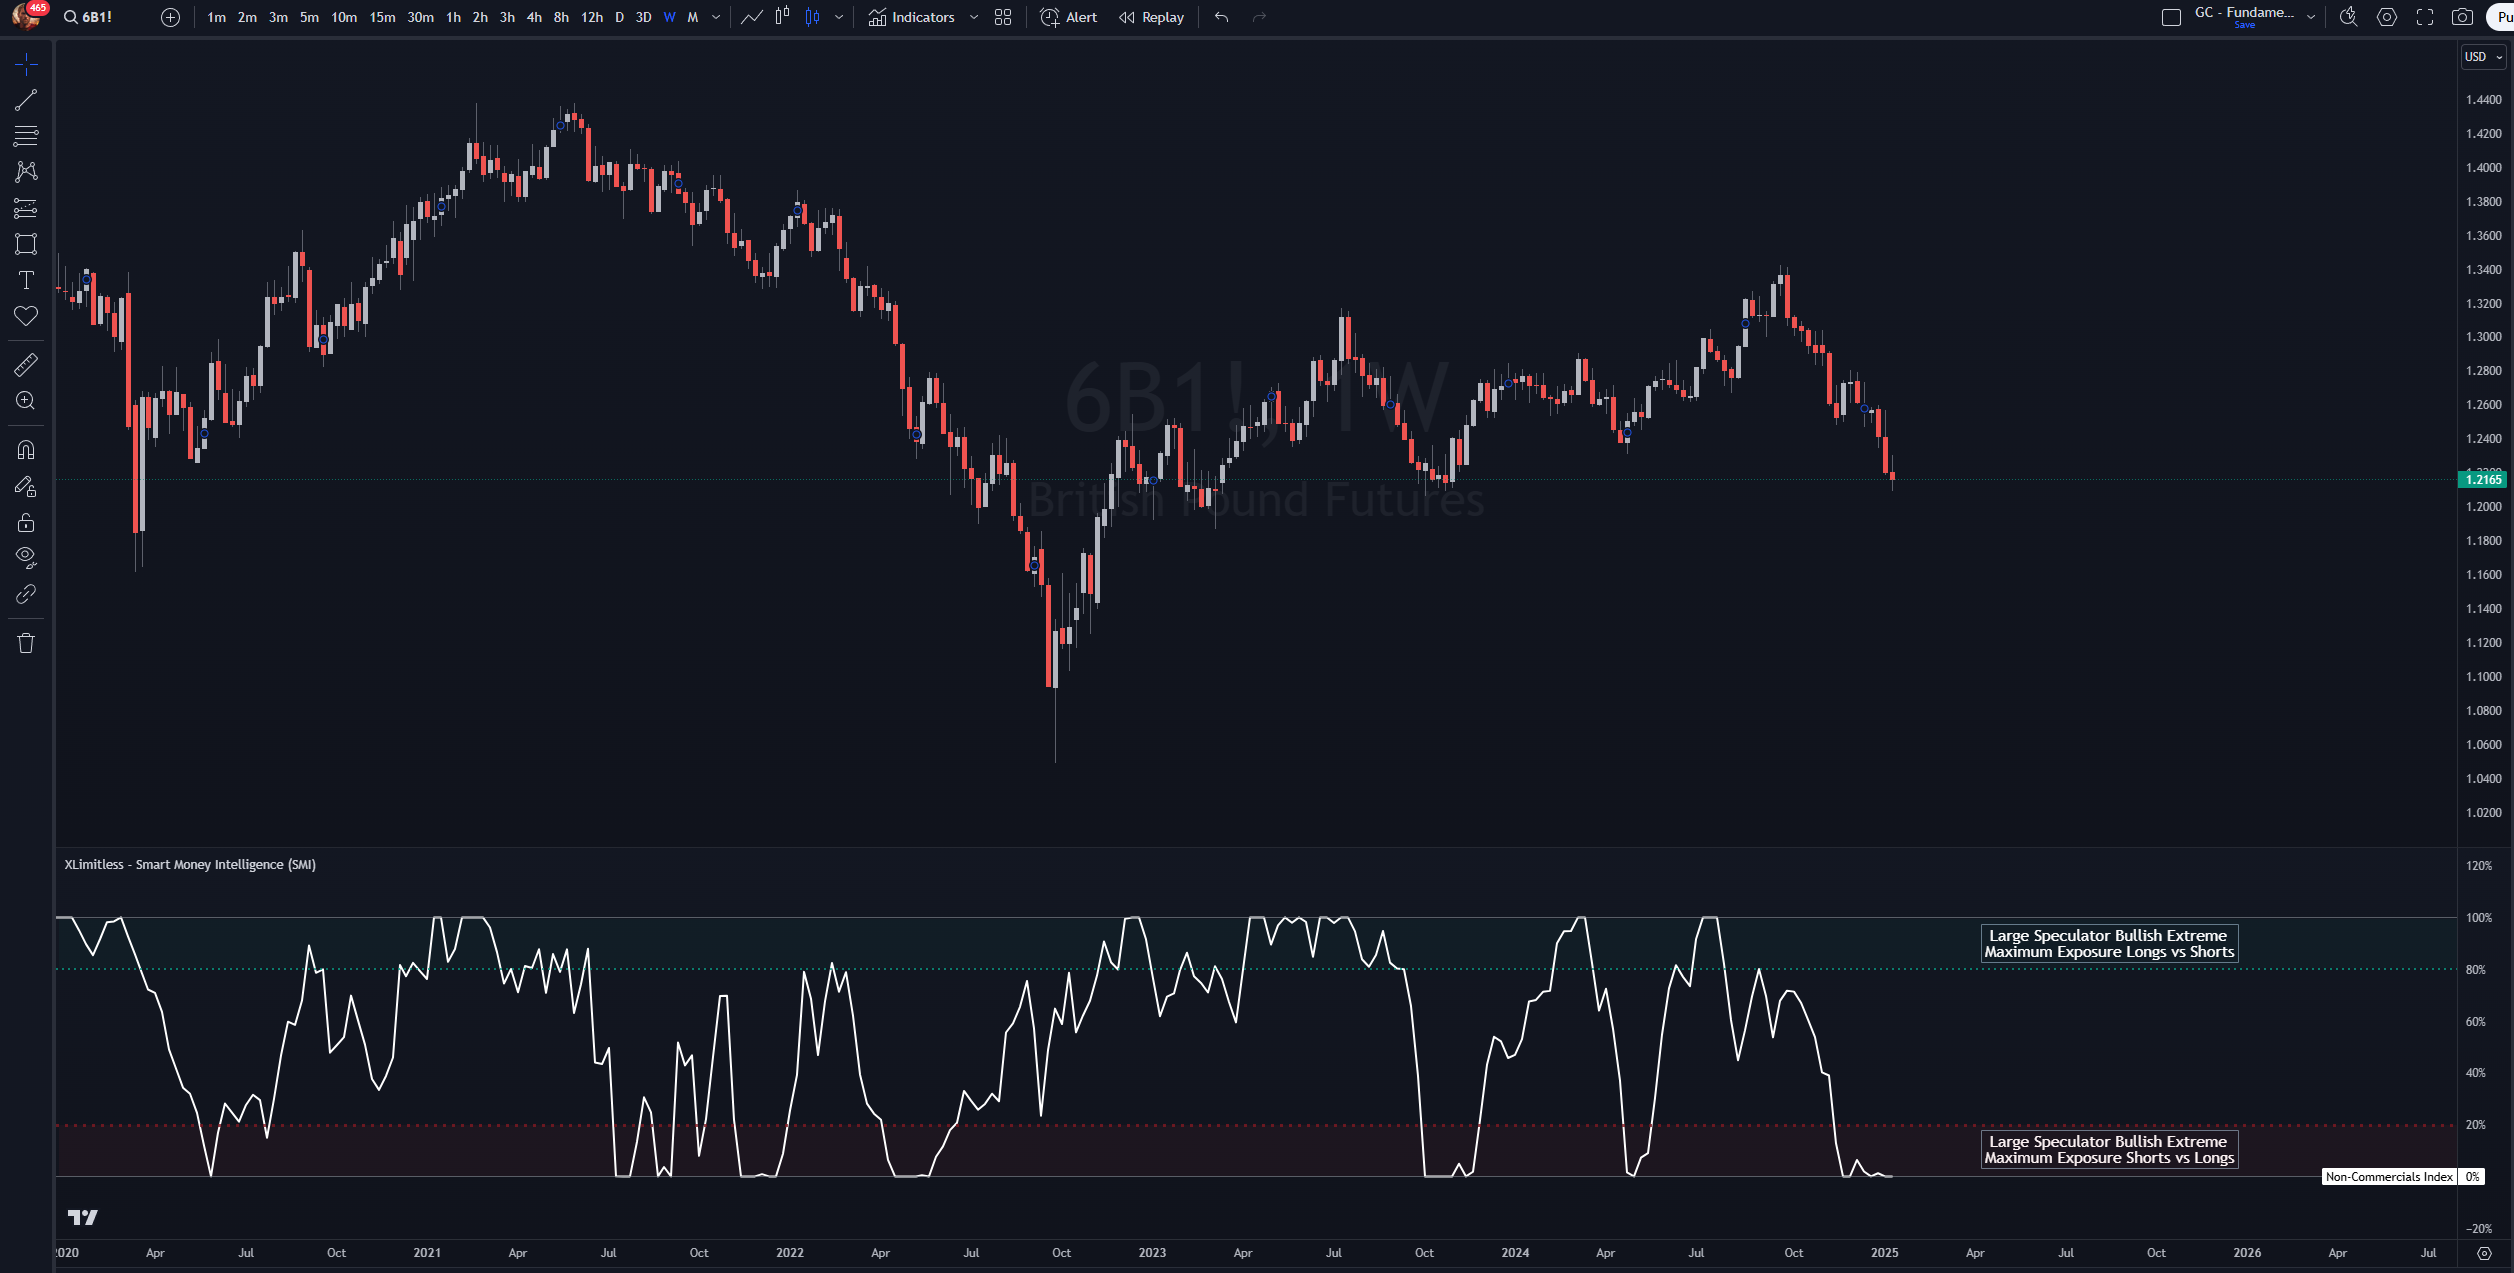
Tracks Non-Commercials (Banks or Institutional Funds, Large Traders).
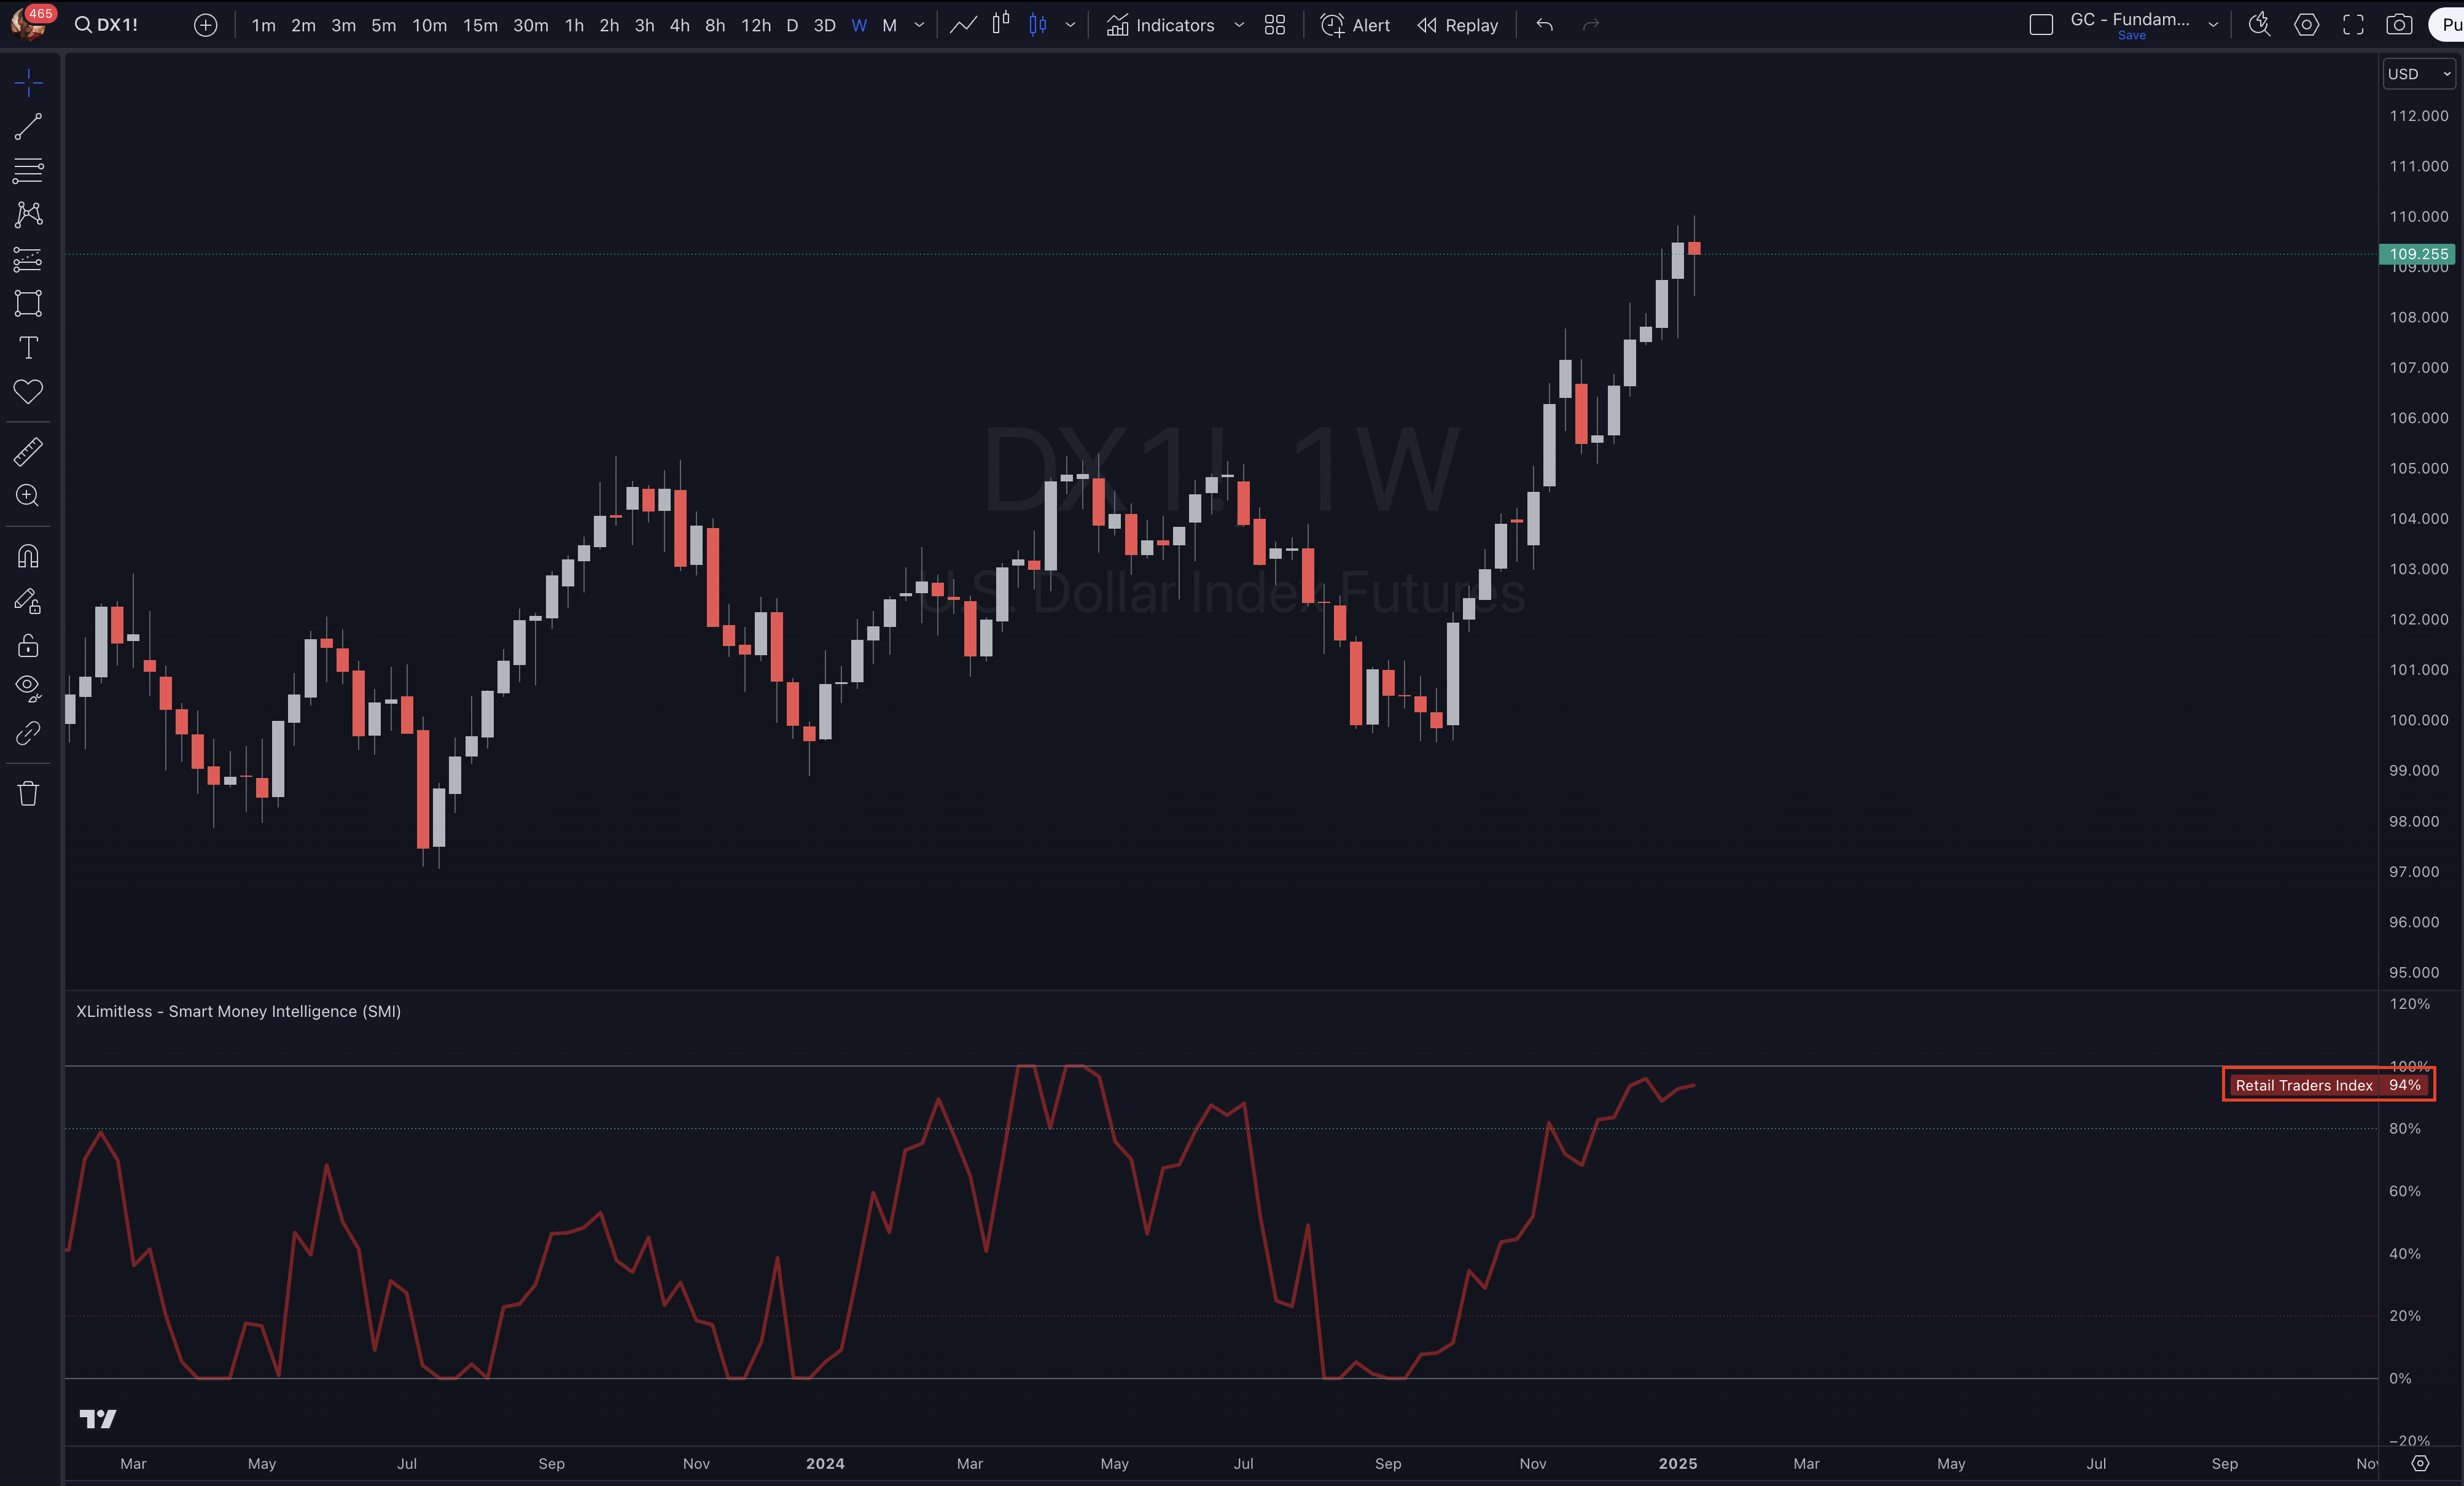
Tracks Retail Traders (Non-Reportables, Small Traders).
Offers normalization to identify overbought or oversold conditions based on historical ranges.
Adding the Indicator
1. Open TradingView.
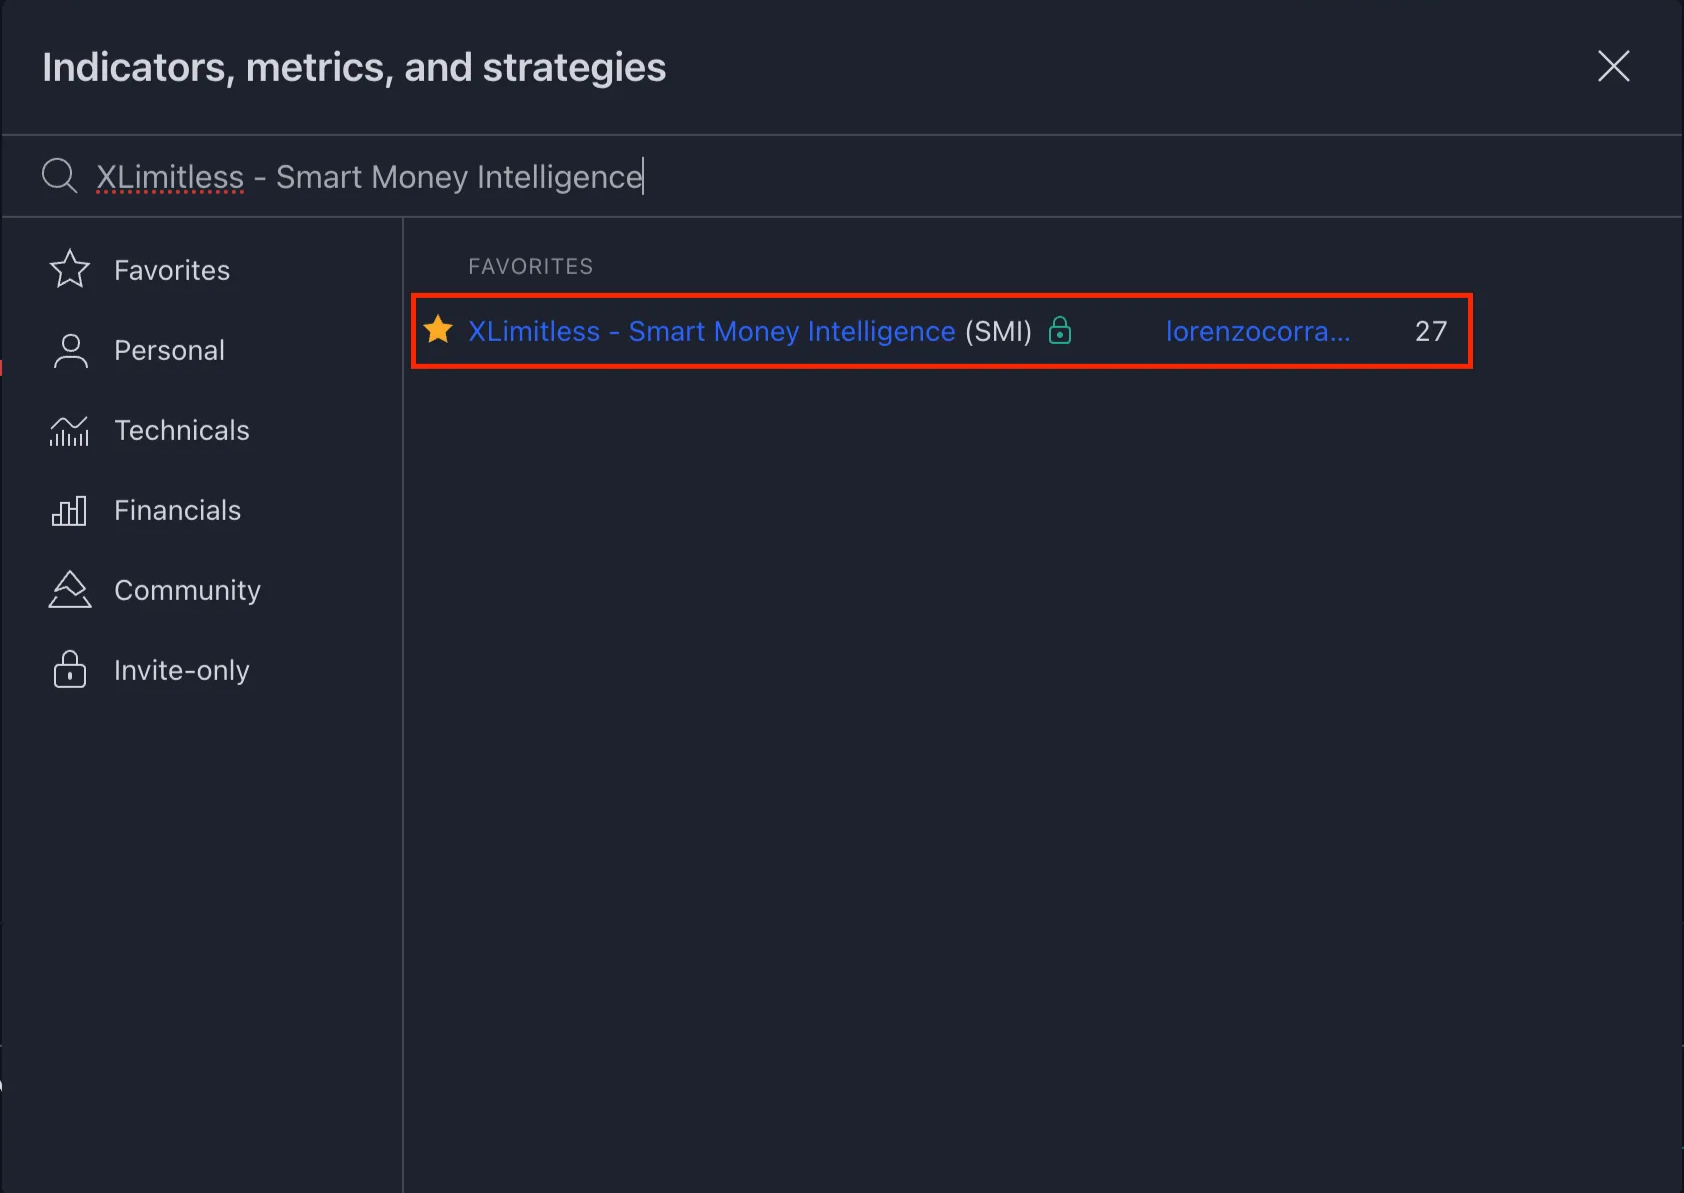
2. Navigate to the "Indicators" tab and click on “Invite Only”.
3. Search for "X Limitless - Smart Money Intelligence (SMI)" and add it to your chart.
4. Apply the Weekly Timeframe.
Customizing Inputs
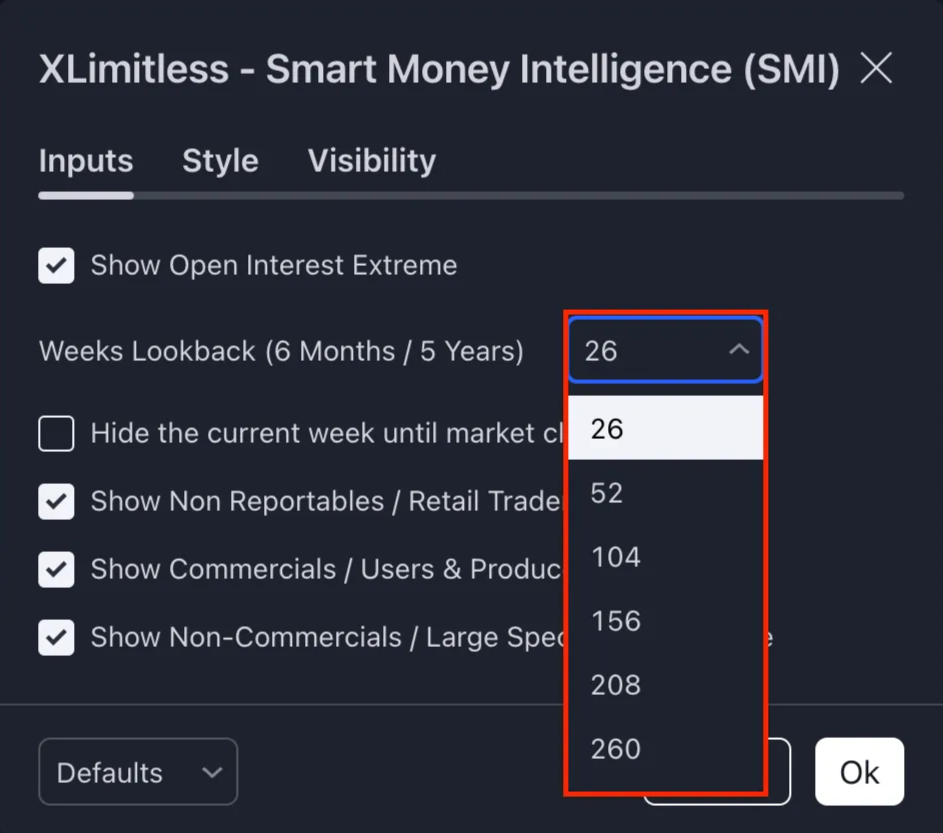
Weeks Lookback: Select a lookback period for normalization (In Weeks):
26 weeks - 6 months
52 weeks - 1 year
104 weeks - 2 years
156 weeks - 3 years
208 weeks - 4 years
260 weeks - 5 years
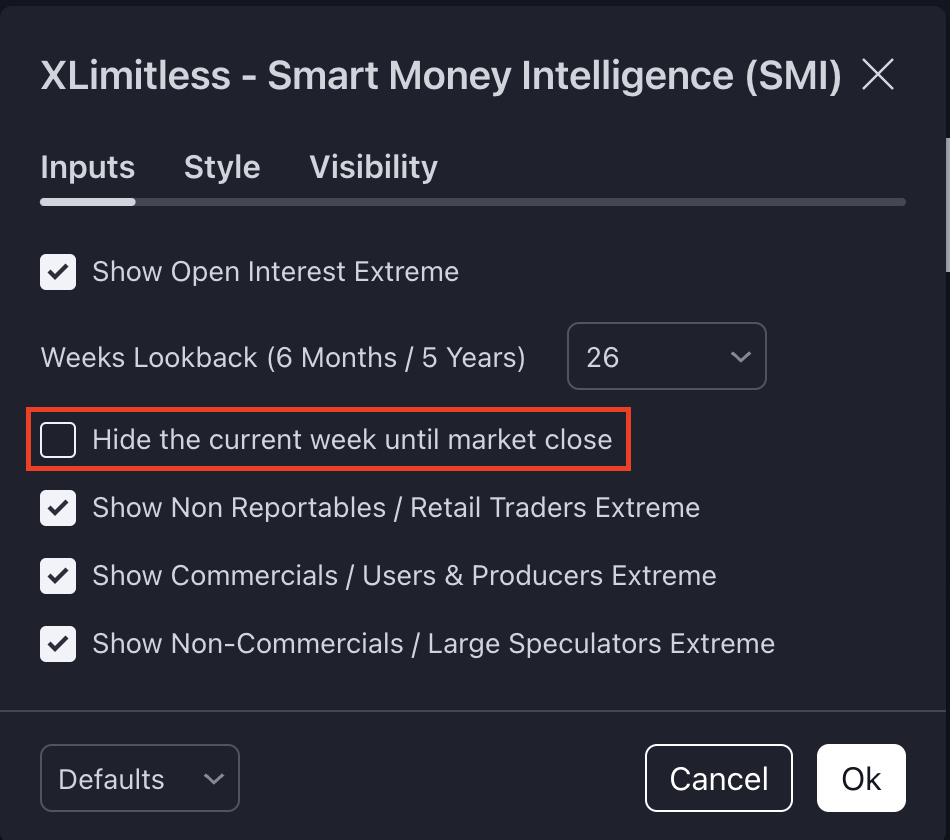
Hide Current Week: Enable to exclude the current week’s data until market closure.
Interpret the Plots
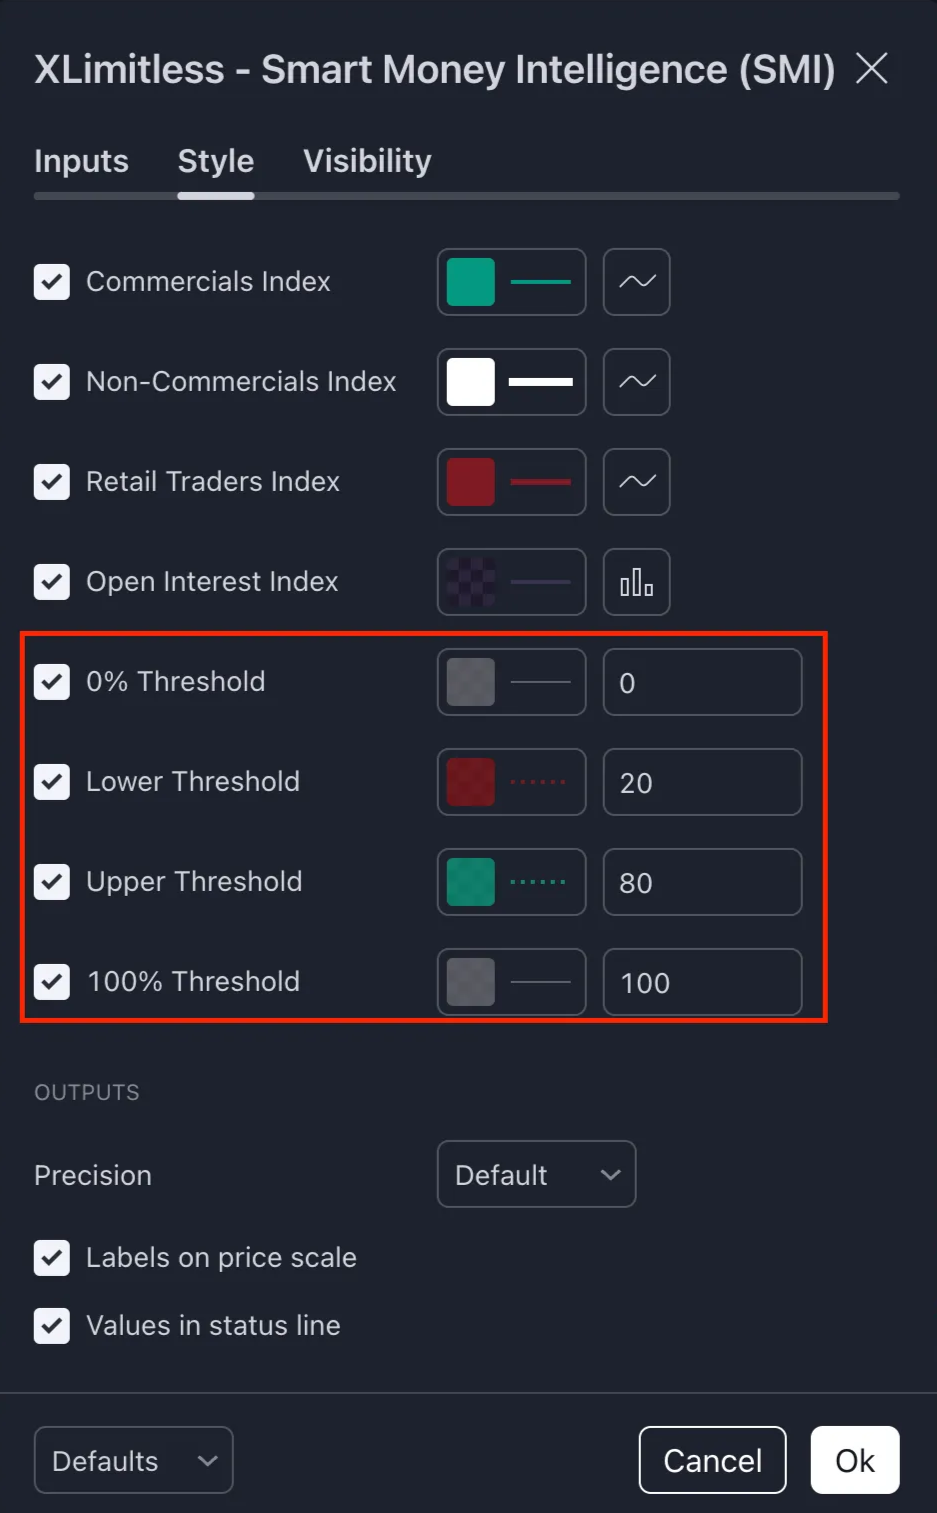
Includes horizontal threshold lines for easy interpretation (e.g., 0%, 20%, 80%, 100%).
0% - Maximum Bearish Extreme
20% - Bearish Extreme
80% - Bullish Extreme
100% - Maximum Bullish Extreme
Data Normalization
For each participant group, the indicator calculates net long positions:
The data is normalized to a 0-100% scale using historical minimum and maximum values within the selected lookback period.
Open Interest
Open interest data is also normalized over the chosen lookback period to highlight extreme activity levels.
Dynamic Updates
Data updates daily or weekly (depending on the selected timeframe) to reflect the latest market positioning.
Best Practices
1. Combine with Other Analysis
2. Focus on Extremes
3. Long-Term Trends
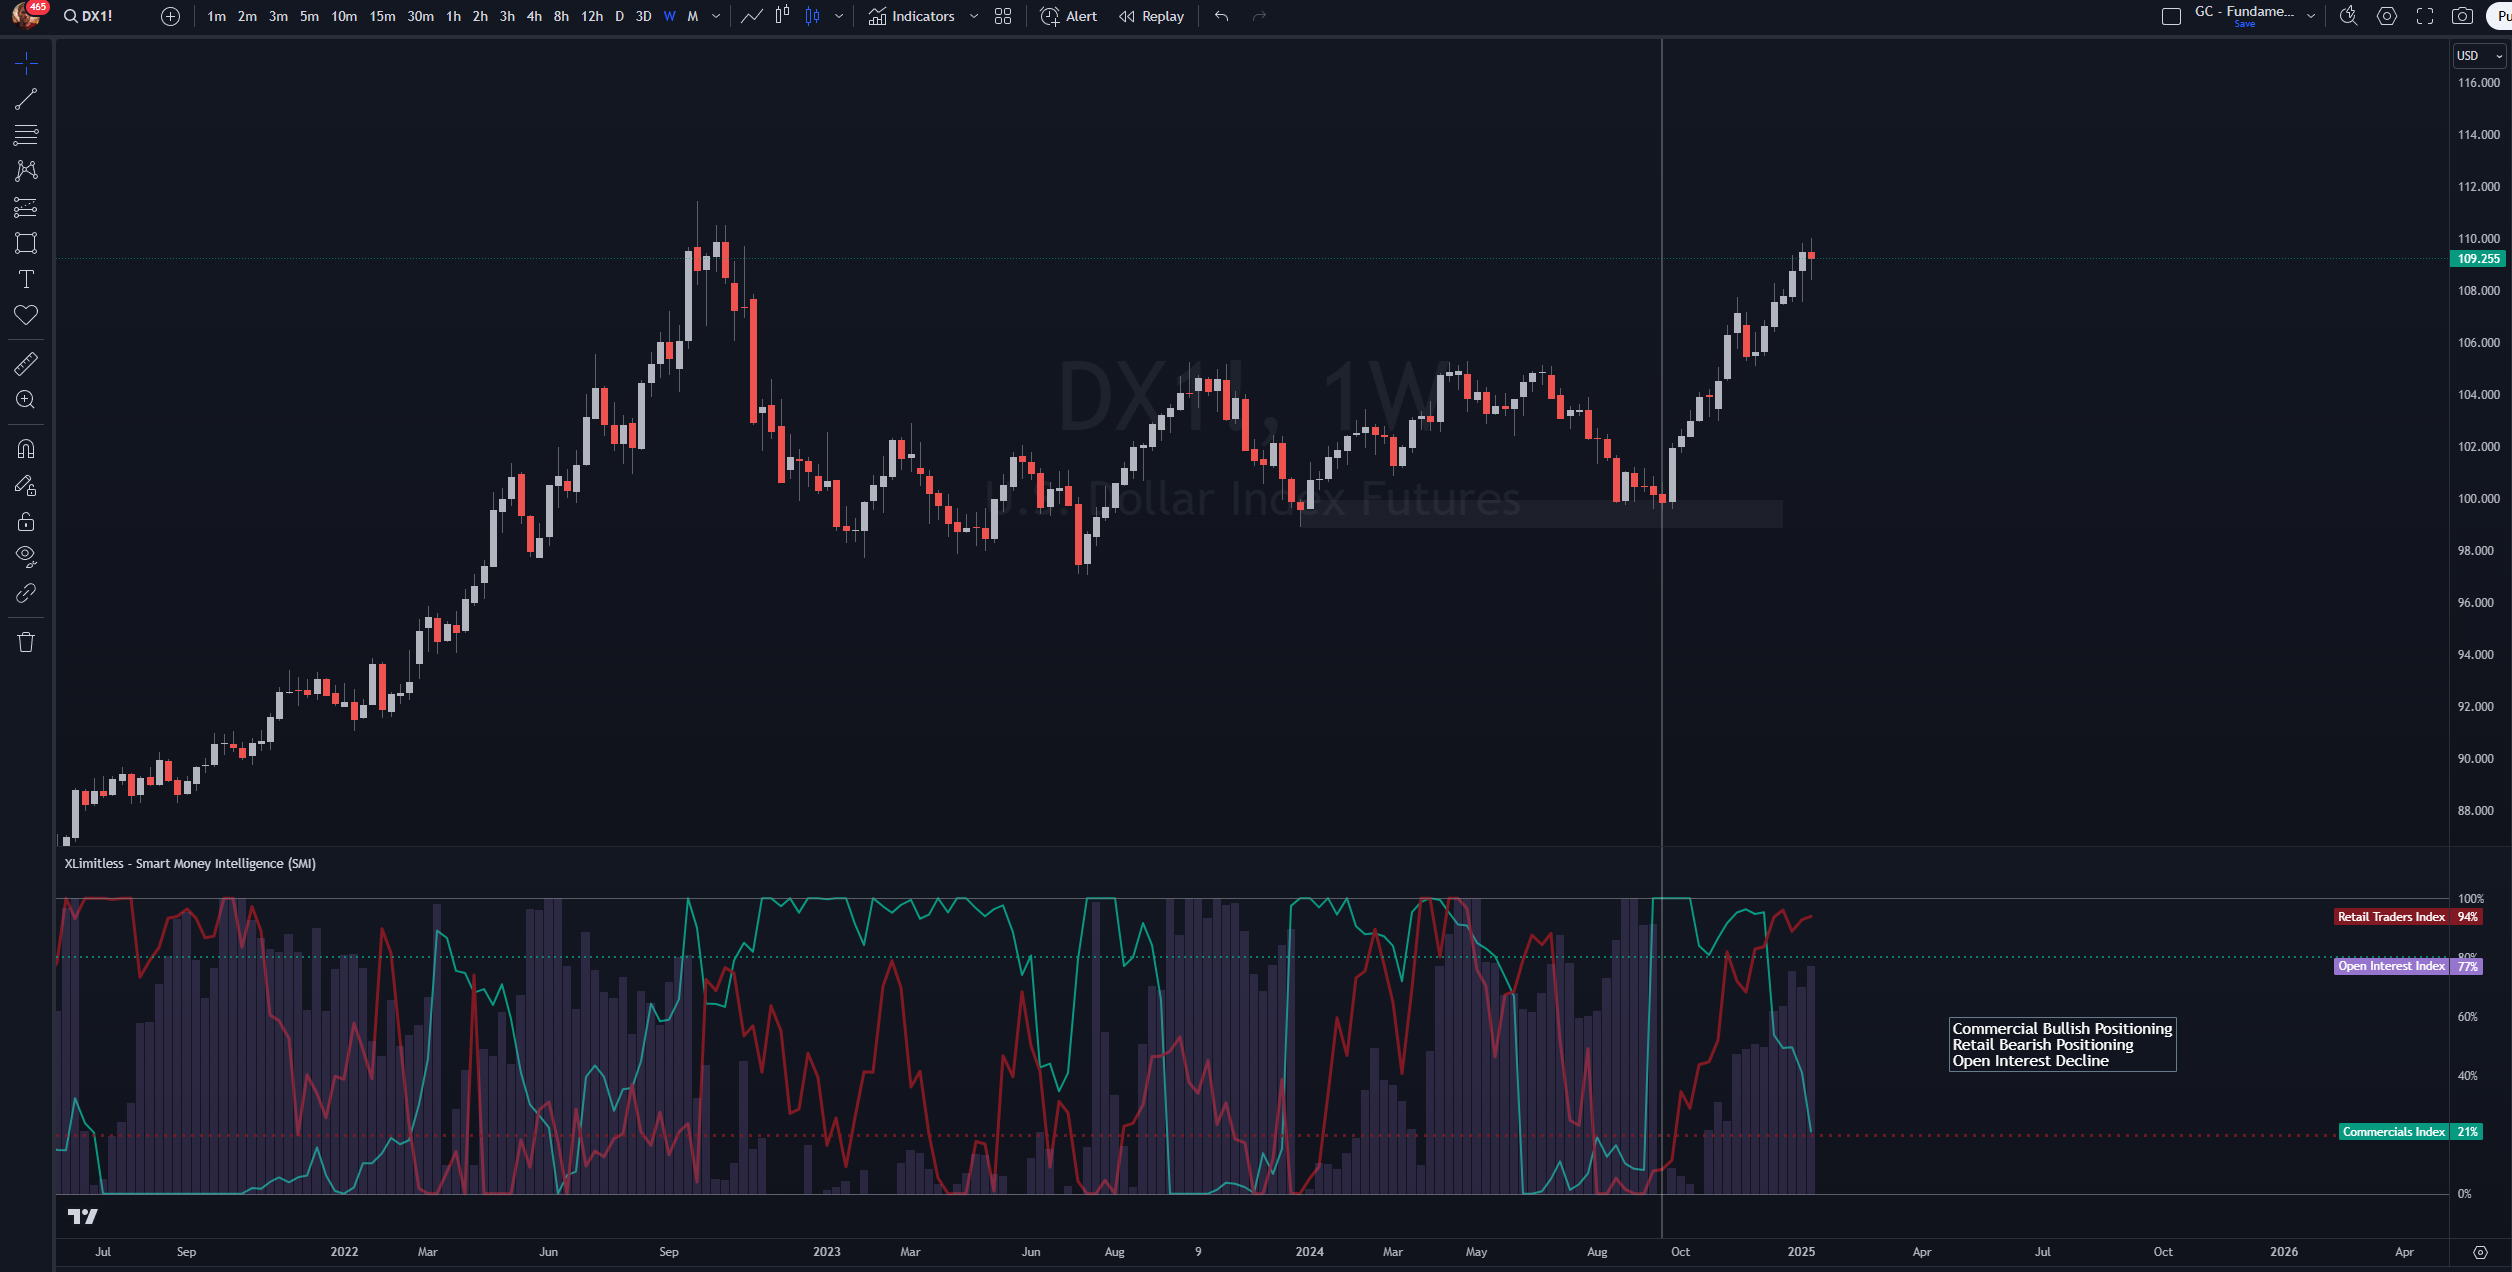
Scenario:
Setup:
Observation:
Conclusion:
1. Why is my chart showing "No relevant data"?
2. What does "Hide Current Week" do?
3. Can I use this indicator for non-futures markets?
Disclaimer
Smart Money Intelligence is designed to gauge market sentiment, making it a valuable tool for additional confluence. However, it is not intended to serve as a timing tool.
Trading involves substantial risk and is not suitable for all investors. Always perform your own due diligence before making financial decisions.
