
Documentation

Menu

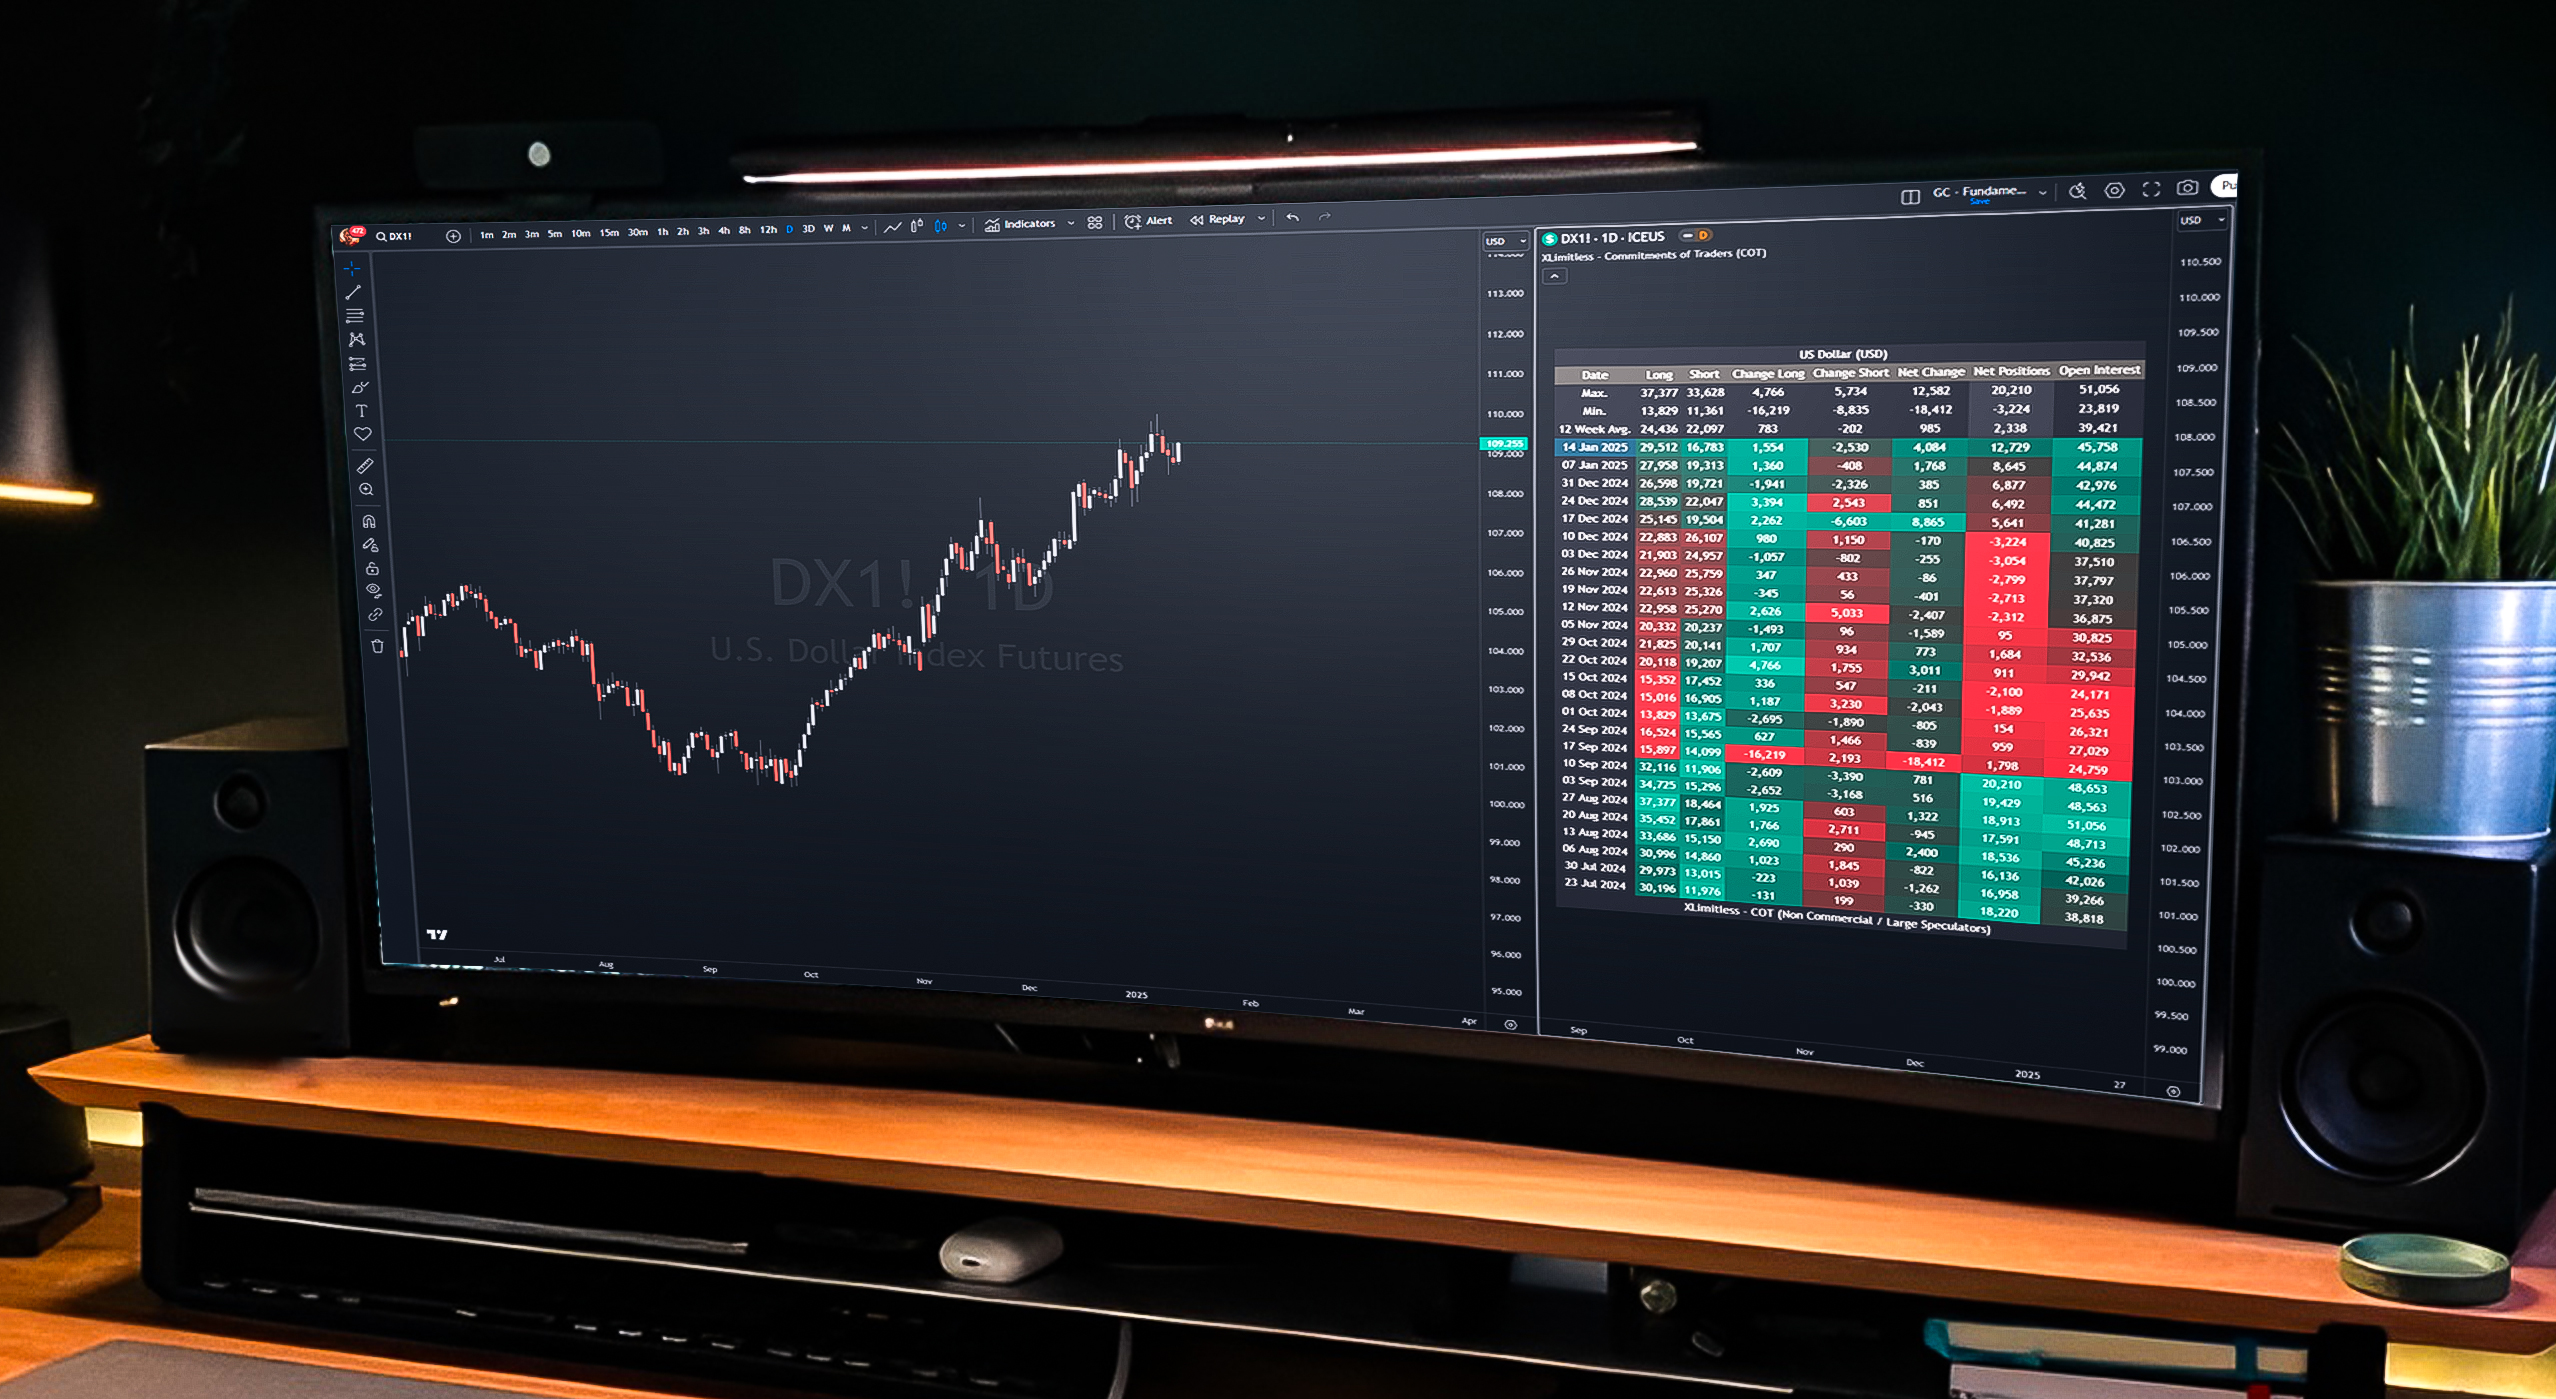
The "X Limitless - Commitments of Traders (COT)" indicator is a comprehensive tool designed to analyze market sentiment based on Commitment of Traders data. By visualizing the positions of key market participants, this indicator enables traders to identify trends, reversals, and key levels of market activity.
Get access to the X Limitless - Commitment of Traders (COT) Indicator1. Detailed Participant Data
2. Customizable Visualizations
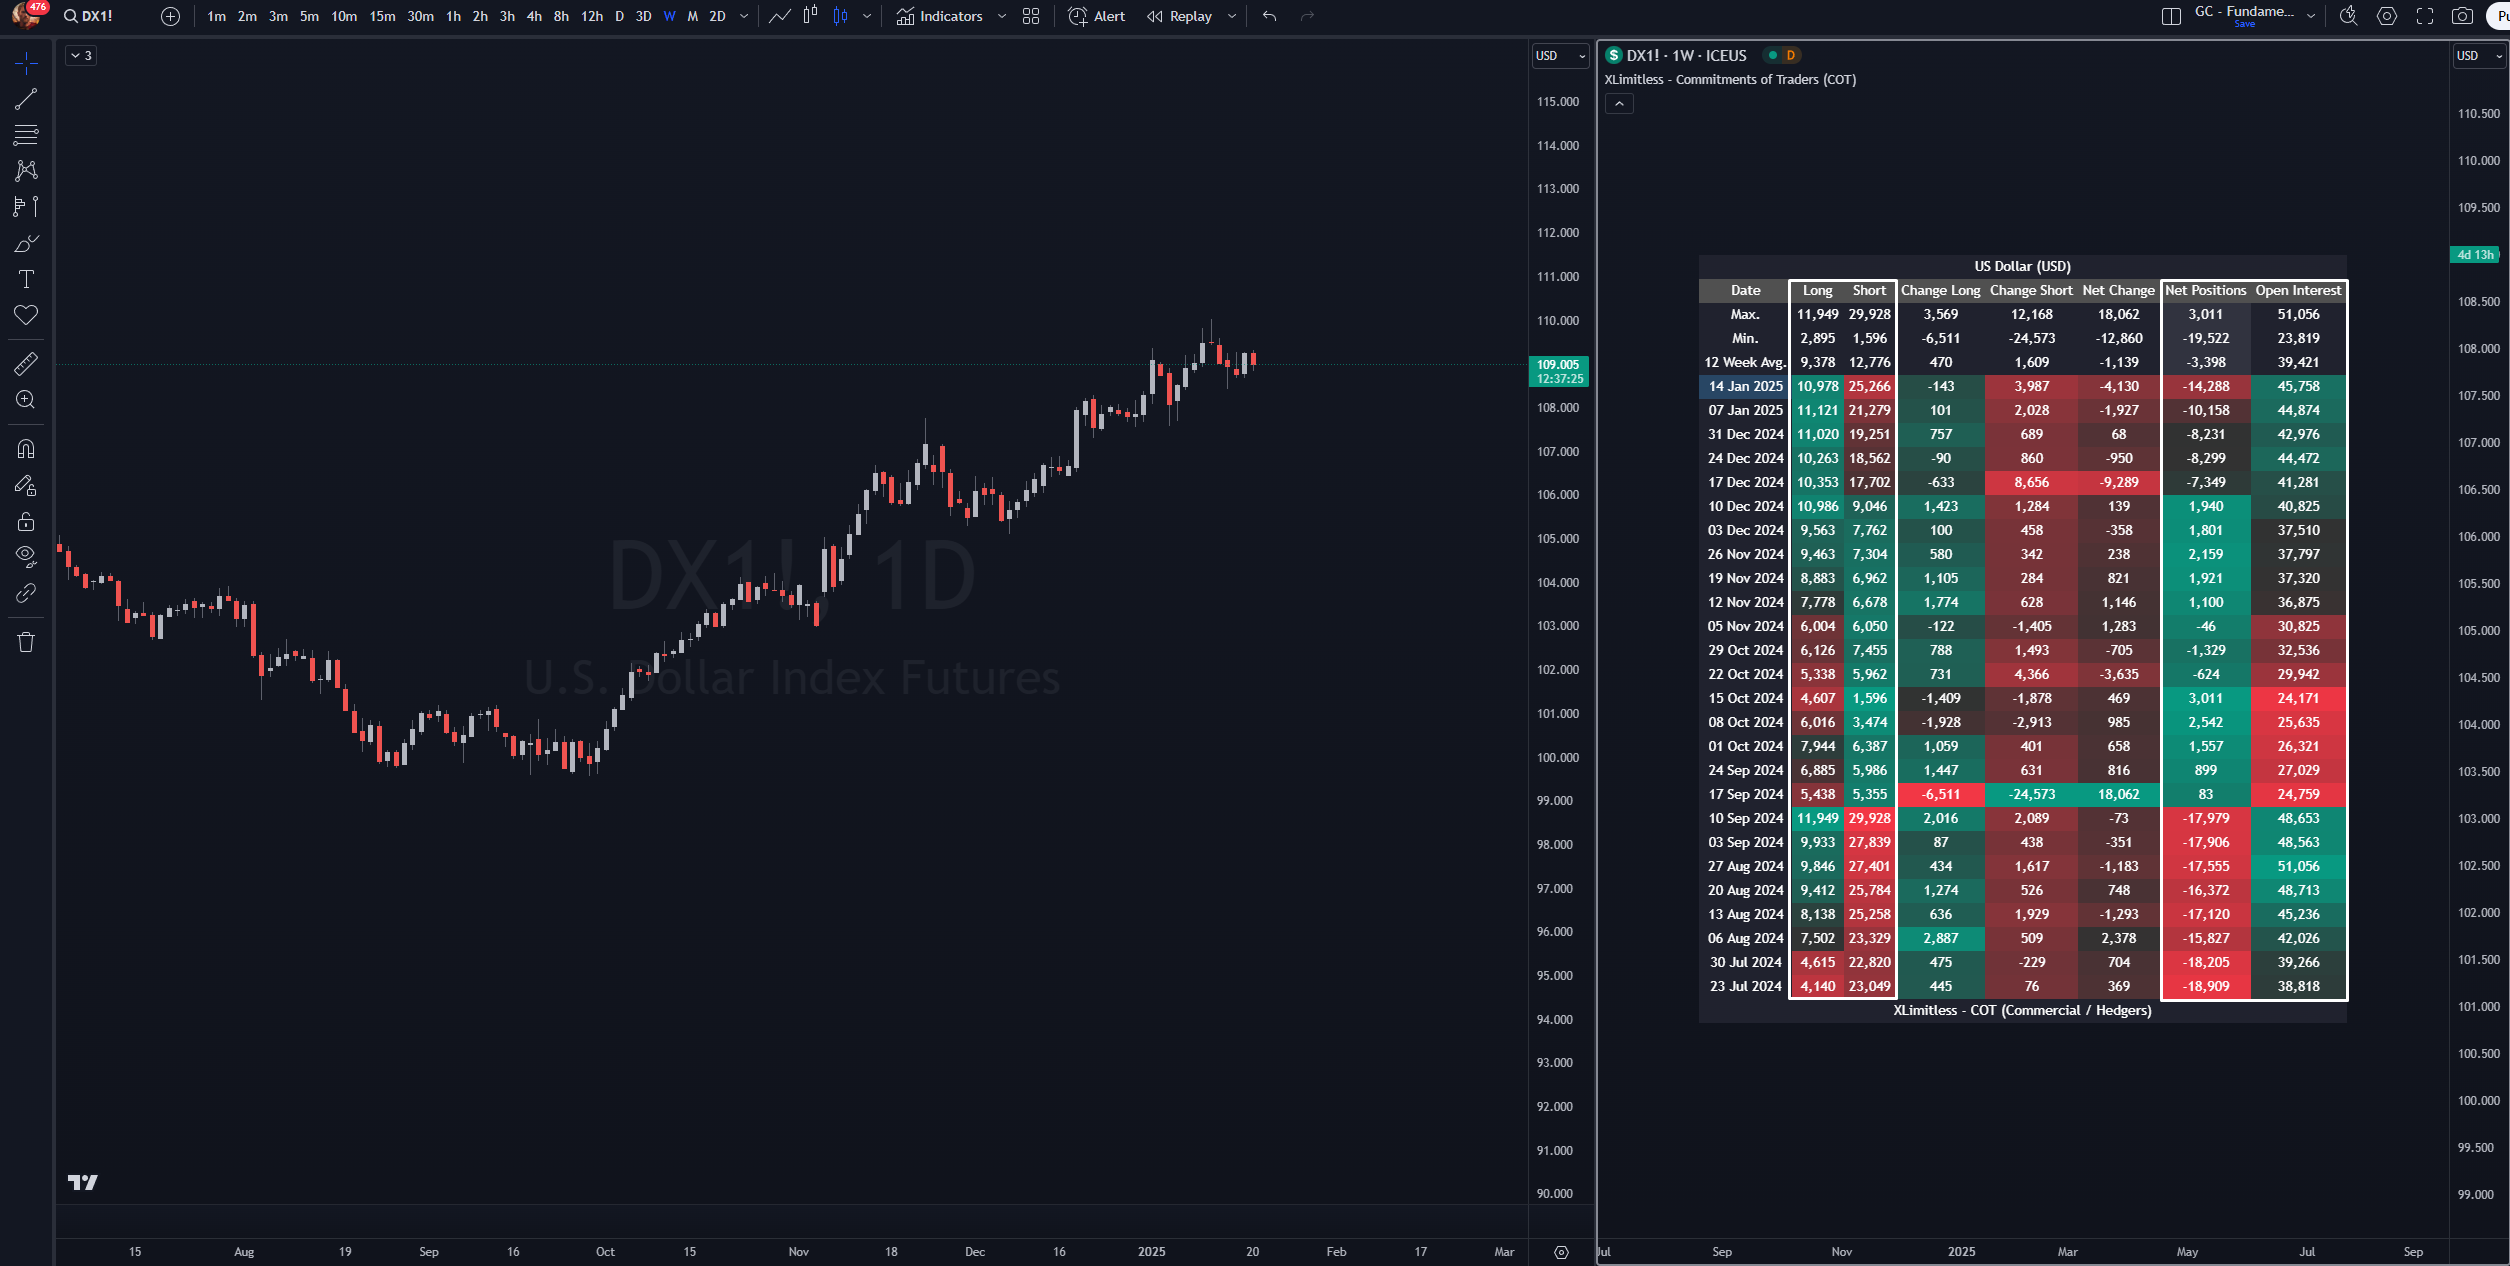
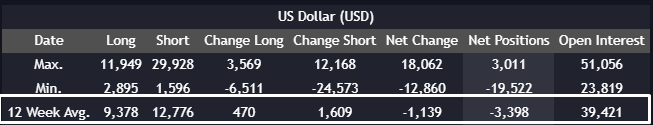
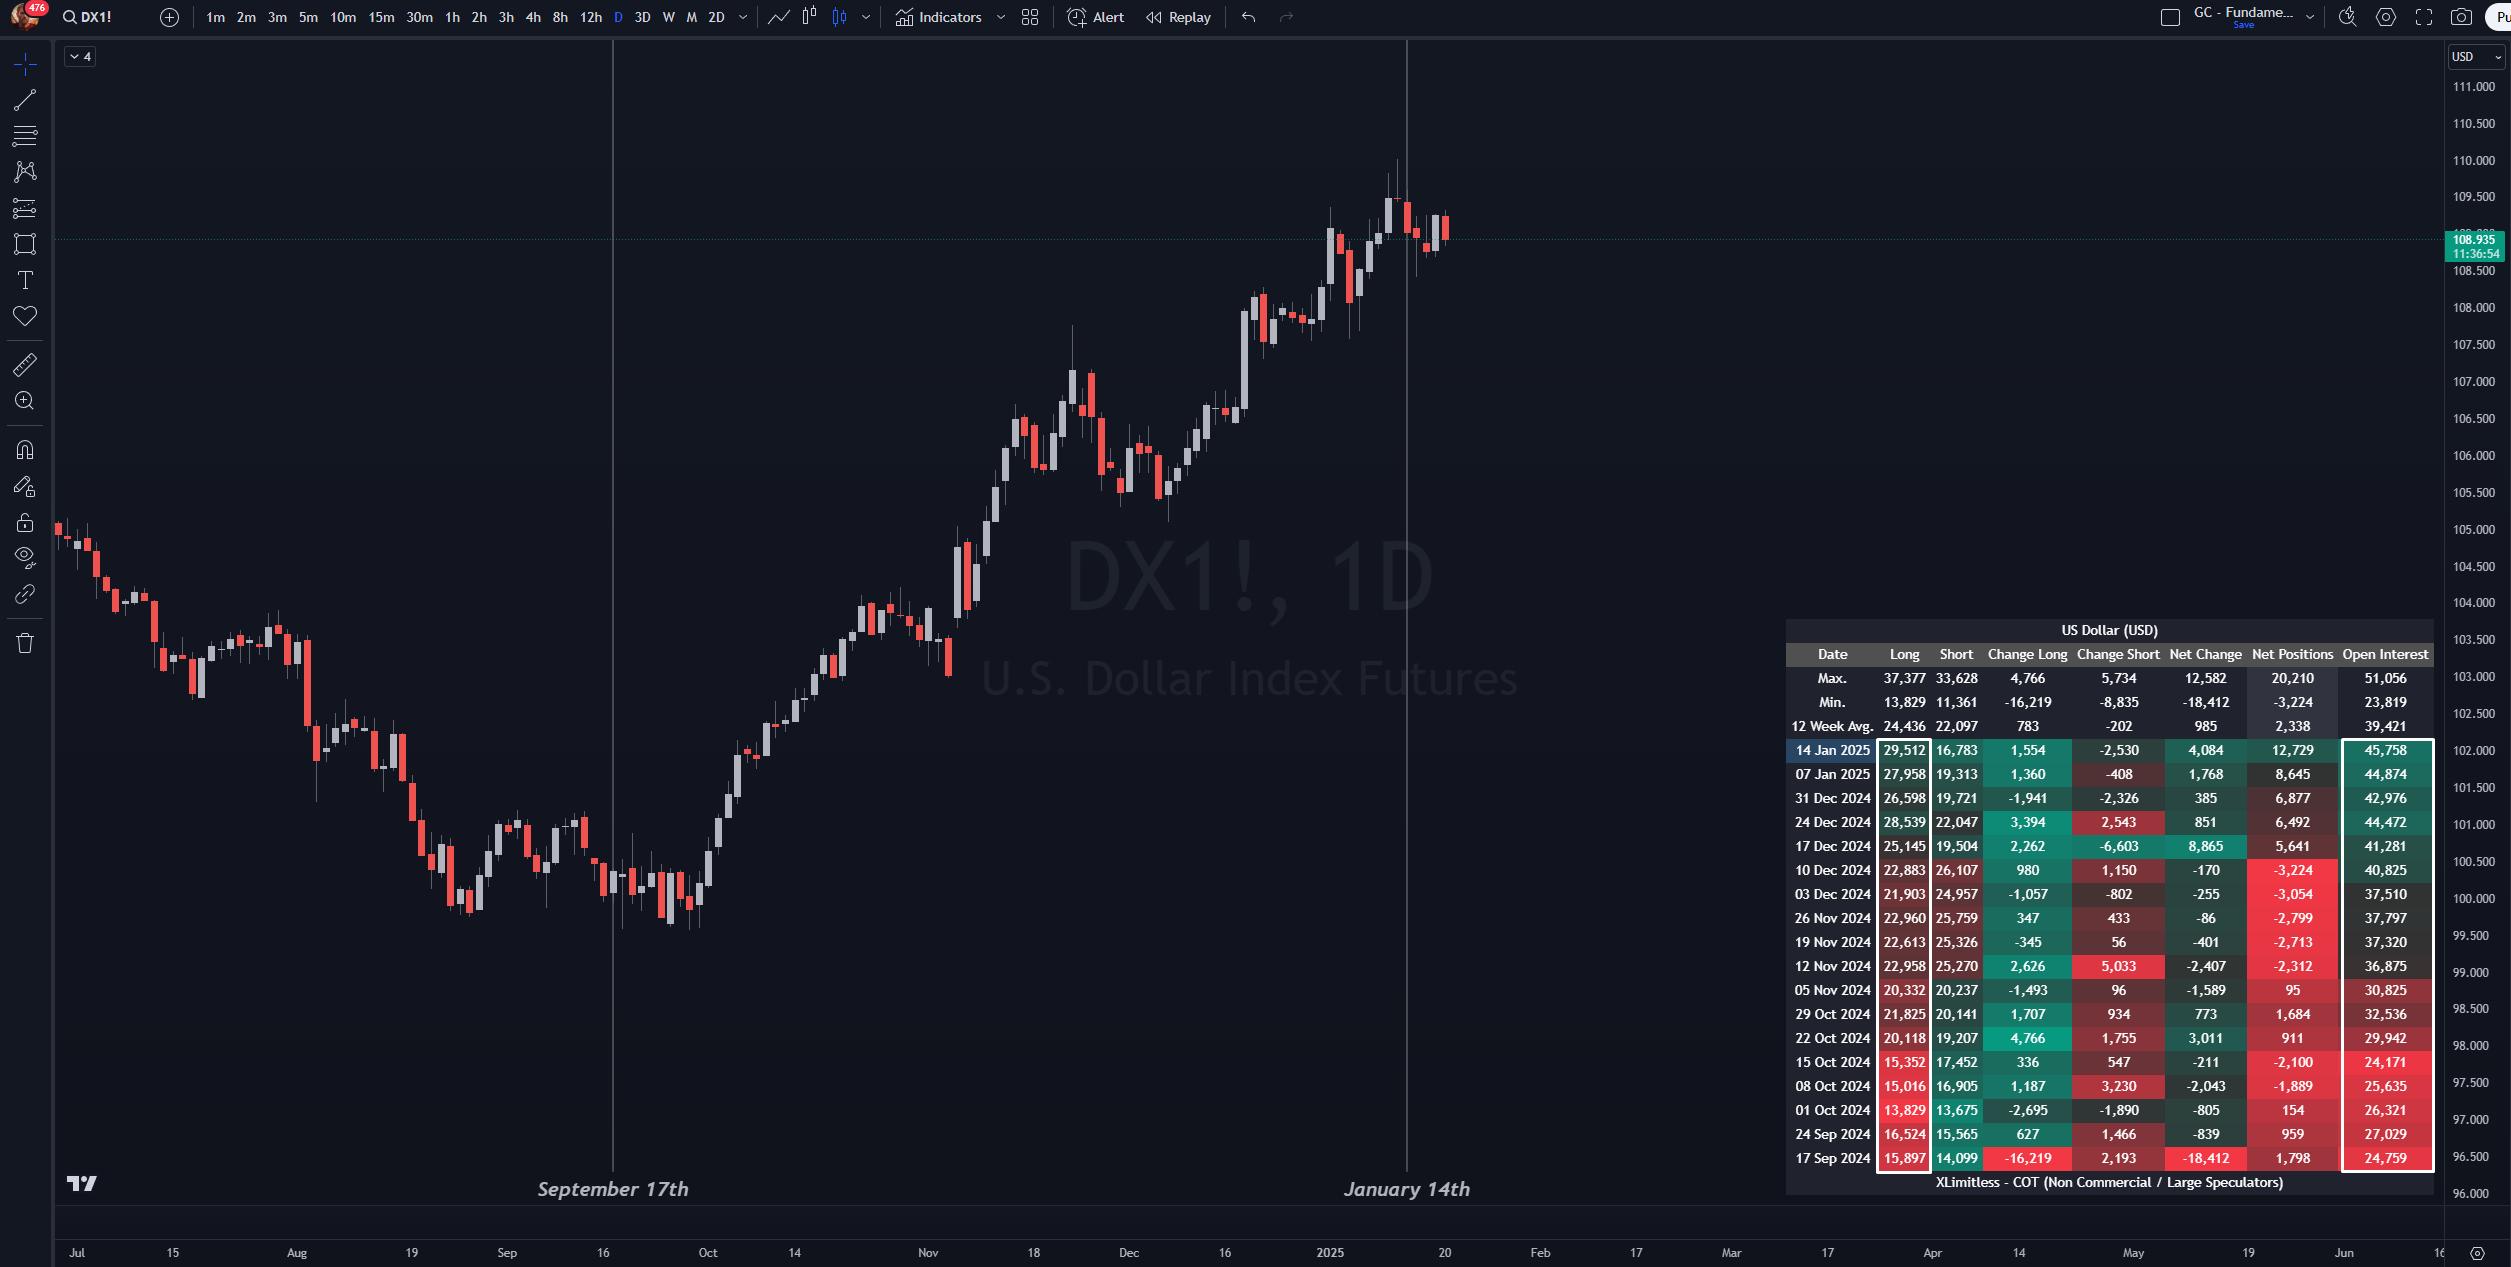
3. Dynamic Table Display
Adding the Indicator
1. Open TradingView.
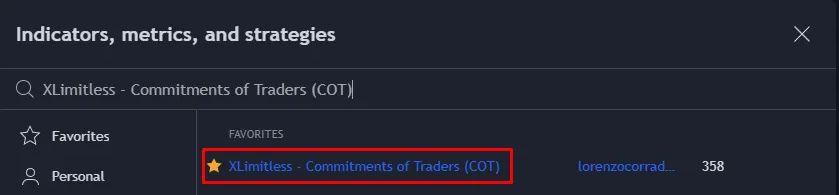
2. Navigate to the "Indicators" tab.
3. Search for "X Limitless - Commitments of Traders (COT)" and add it to your chart.
4. Recommended to use on the Daily Timeframe for faster updates due to the bar calculations.
Customizing Inputs
Table Theme:

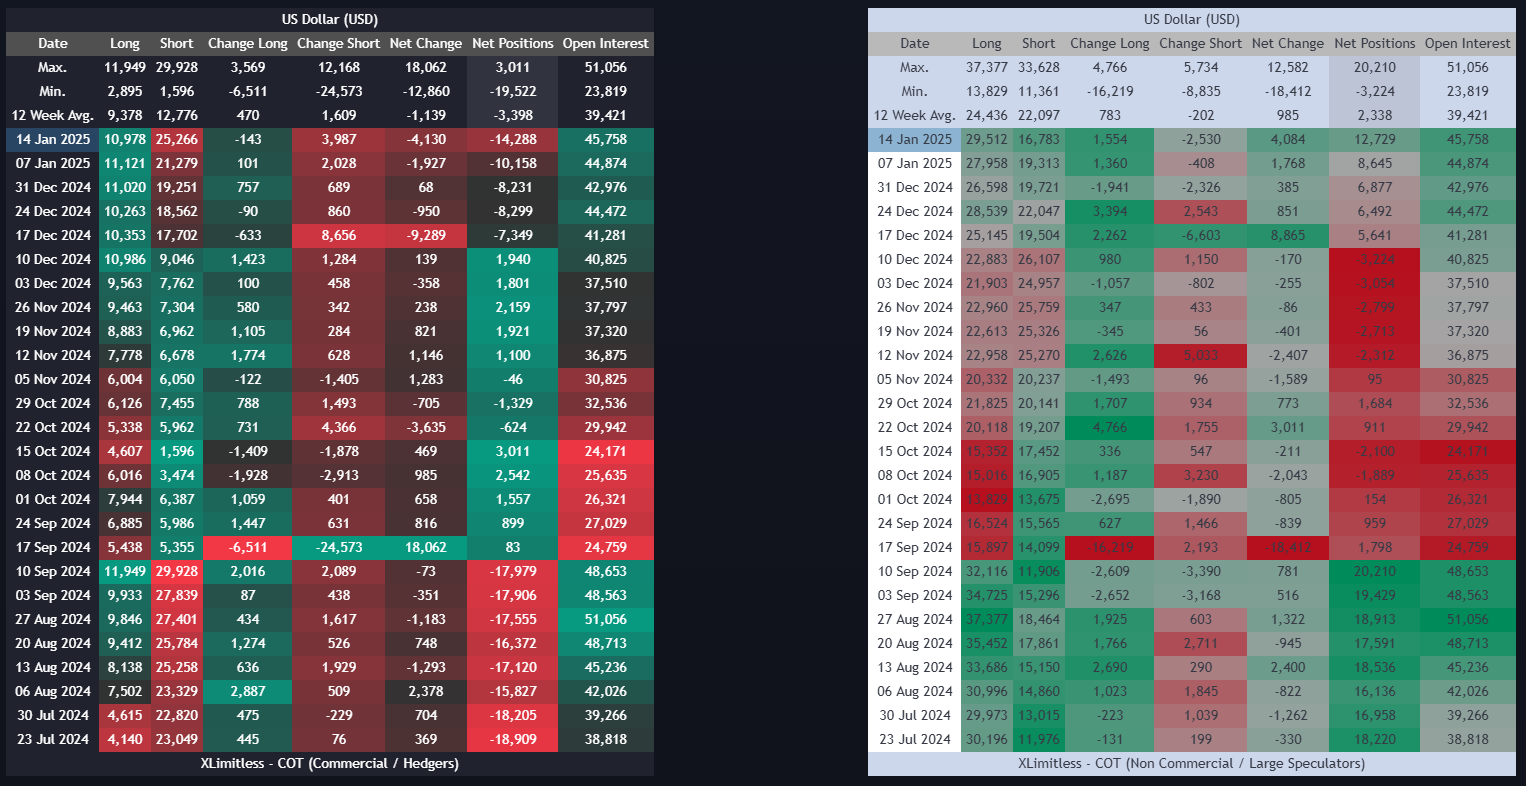
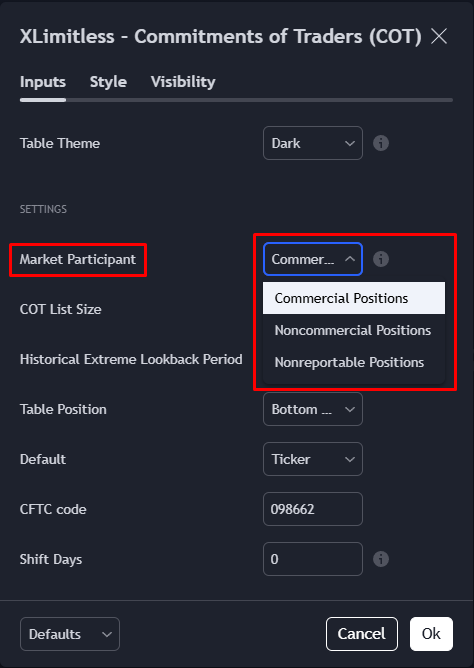
Market Participant:
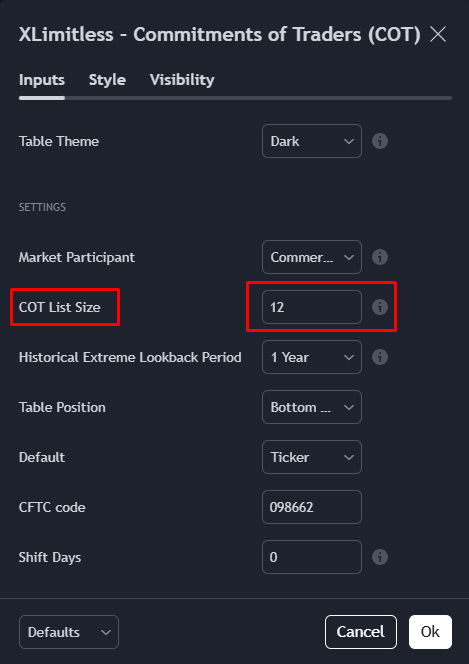
COT List Size:
Historical Extreme Lookback Period:

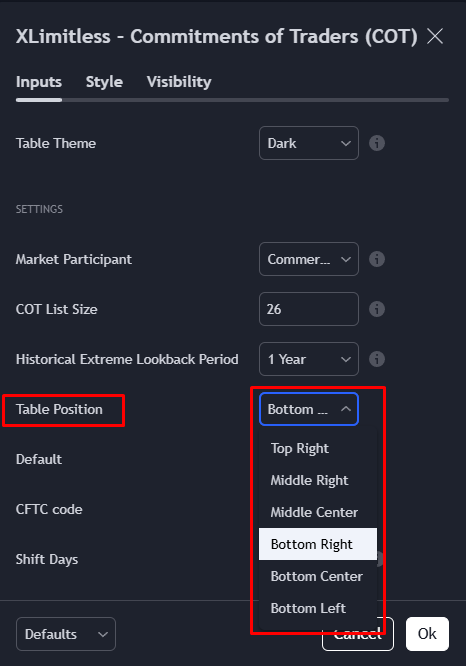
Table Position:
Data Source
Visualization Logic
1. Table Rows and Columns:
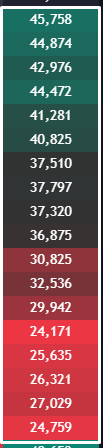
2. Heatmaps
3. Averages and Extremes:
Best Practices
1. Focus on Extremes
2. Combine with Technical Analysis
3. Adjust Lookback Period
4. Monitor Specific Participants
Scenario:
Steps:
1. What is the "12 Week Average"?
Why It’s Useful?
2. Can I analyze multiple assets simultaneously?
3. How often is the data updated?
4. What does the heatmap represent?
Disclaimer
The X Limitless - Commitments of Traders (COT) indicator is designed to provide insights into market sentiment based on historical positioning data. However, it does not guarantee future market performance or outcomes. The indicator relies on COT data, which reflects past market conditions and may not account for sudden market shifts or unforeseen events. Always use this tool as part of a comprehensive trading strategy and perform your own due diligence. Trading involves significant risks, and users are solely responsible for their investment decisions.
