
Documentation

Quickstart

Forecasting market movements is every trader’s dream. With AI FutureScope™ it’s a reality. By blending historical data with our proprietary algorithms, your personal market oracle gives you a glimpse into the future.
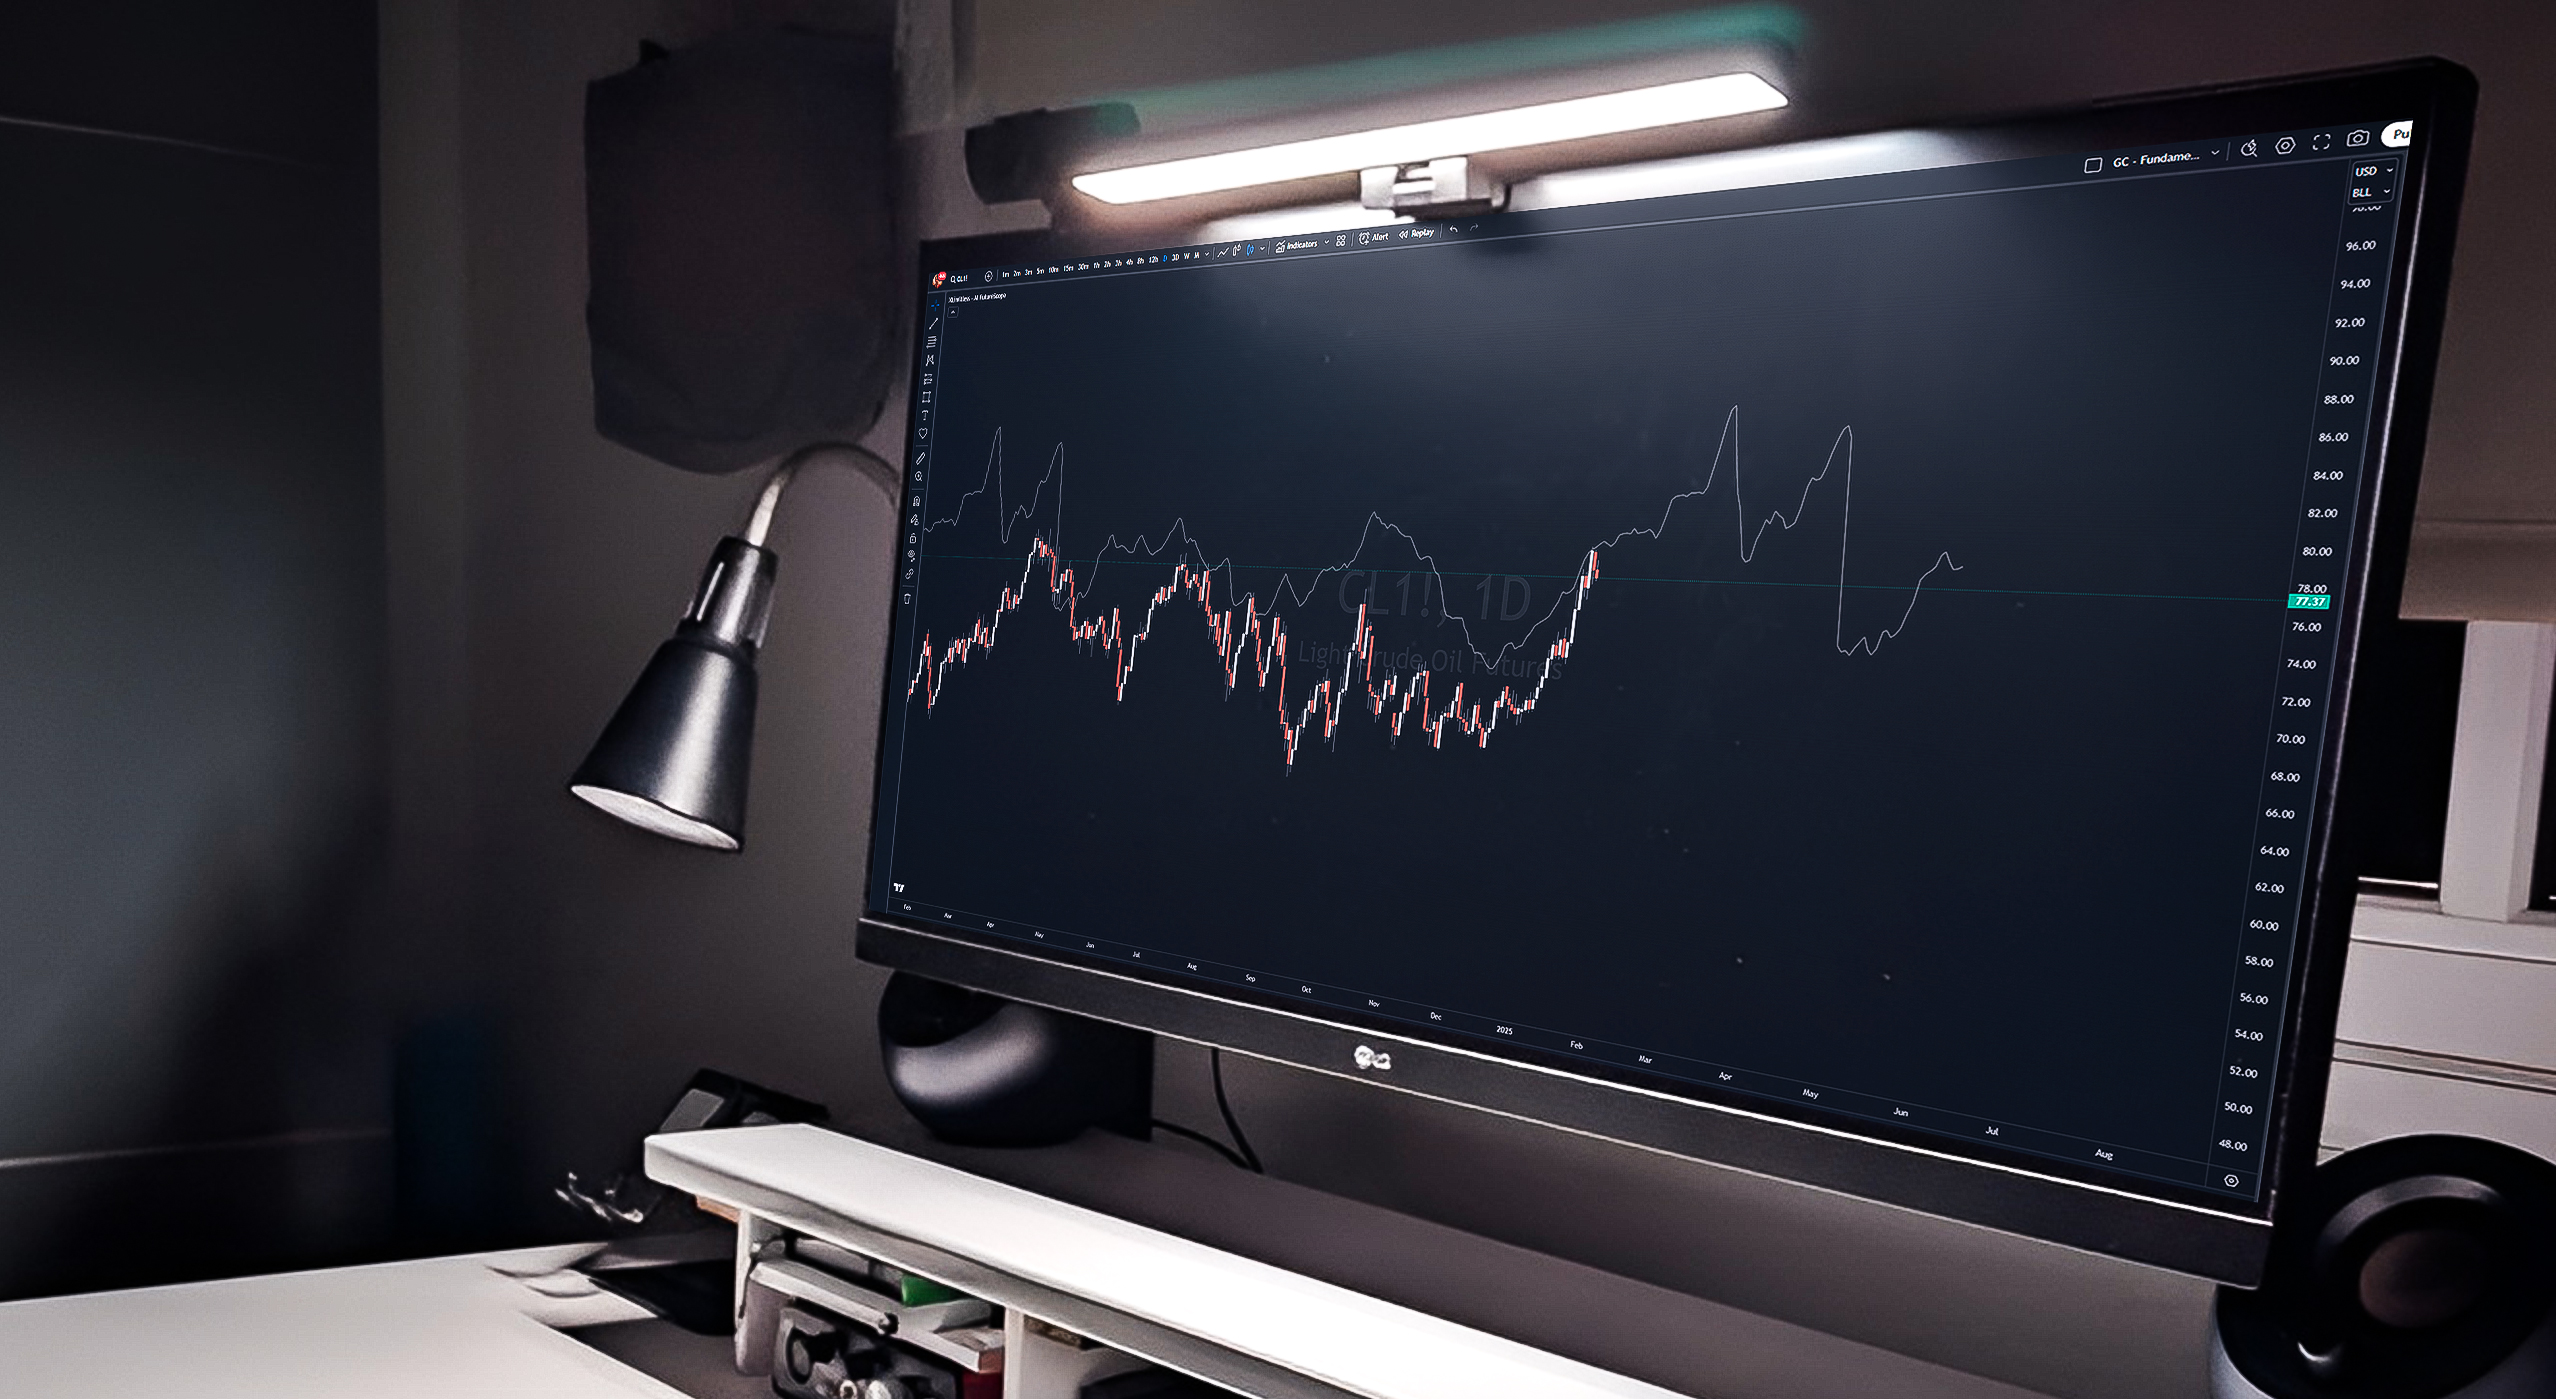
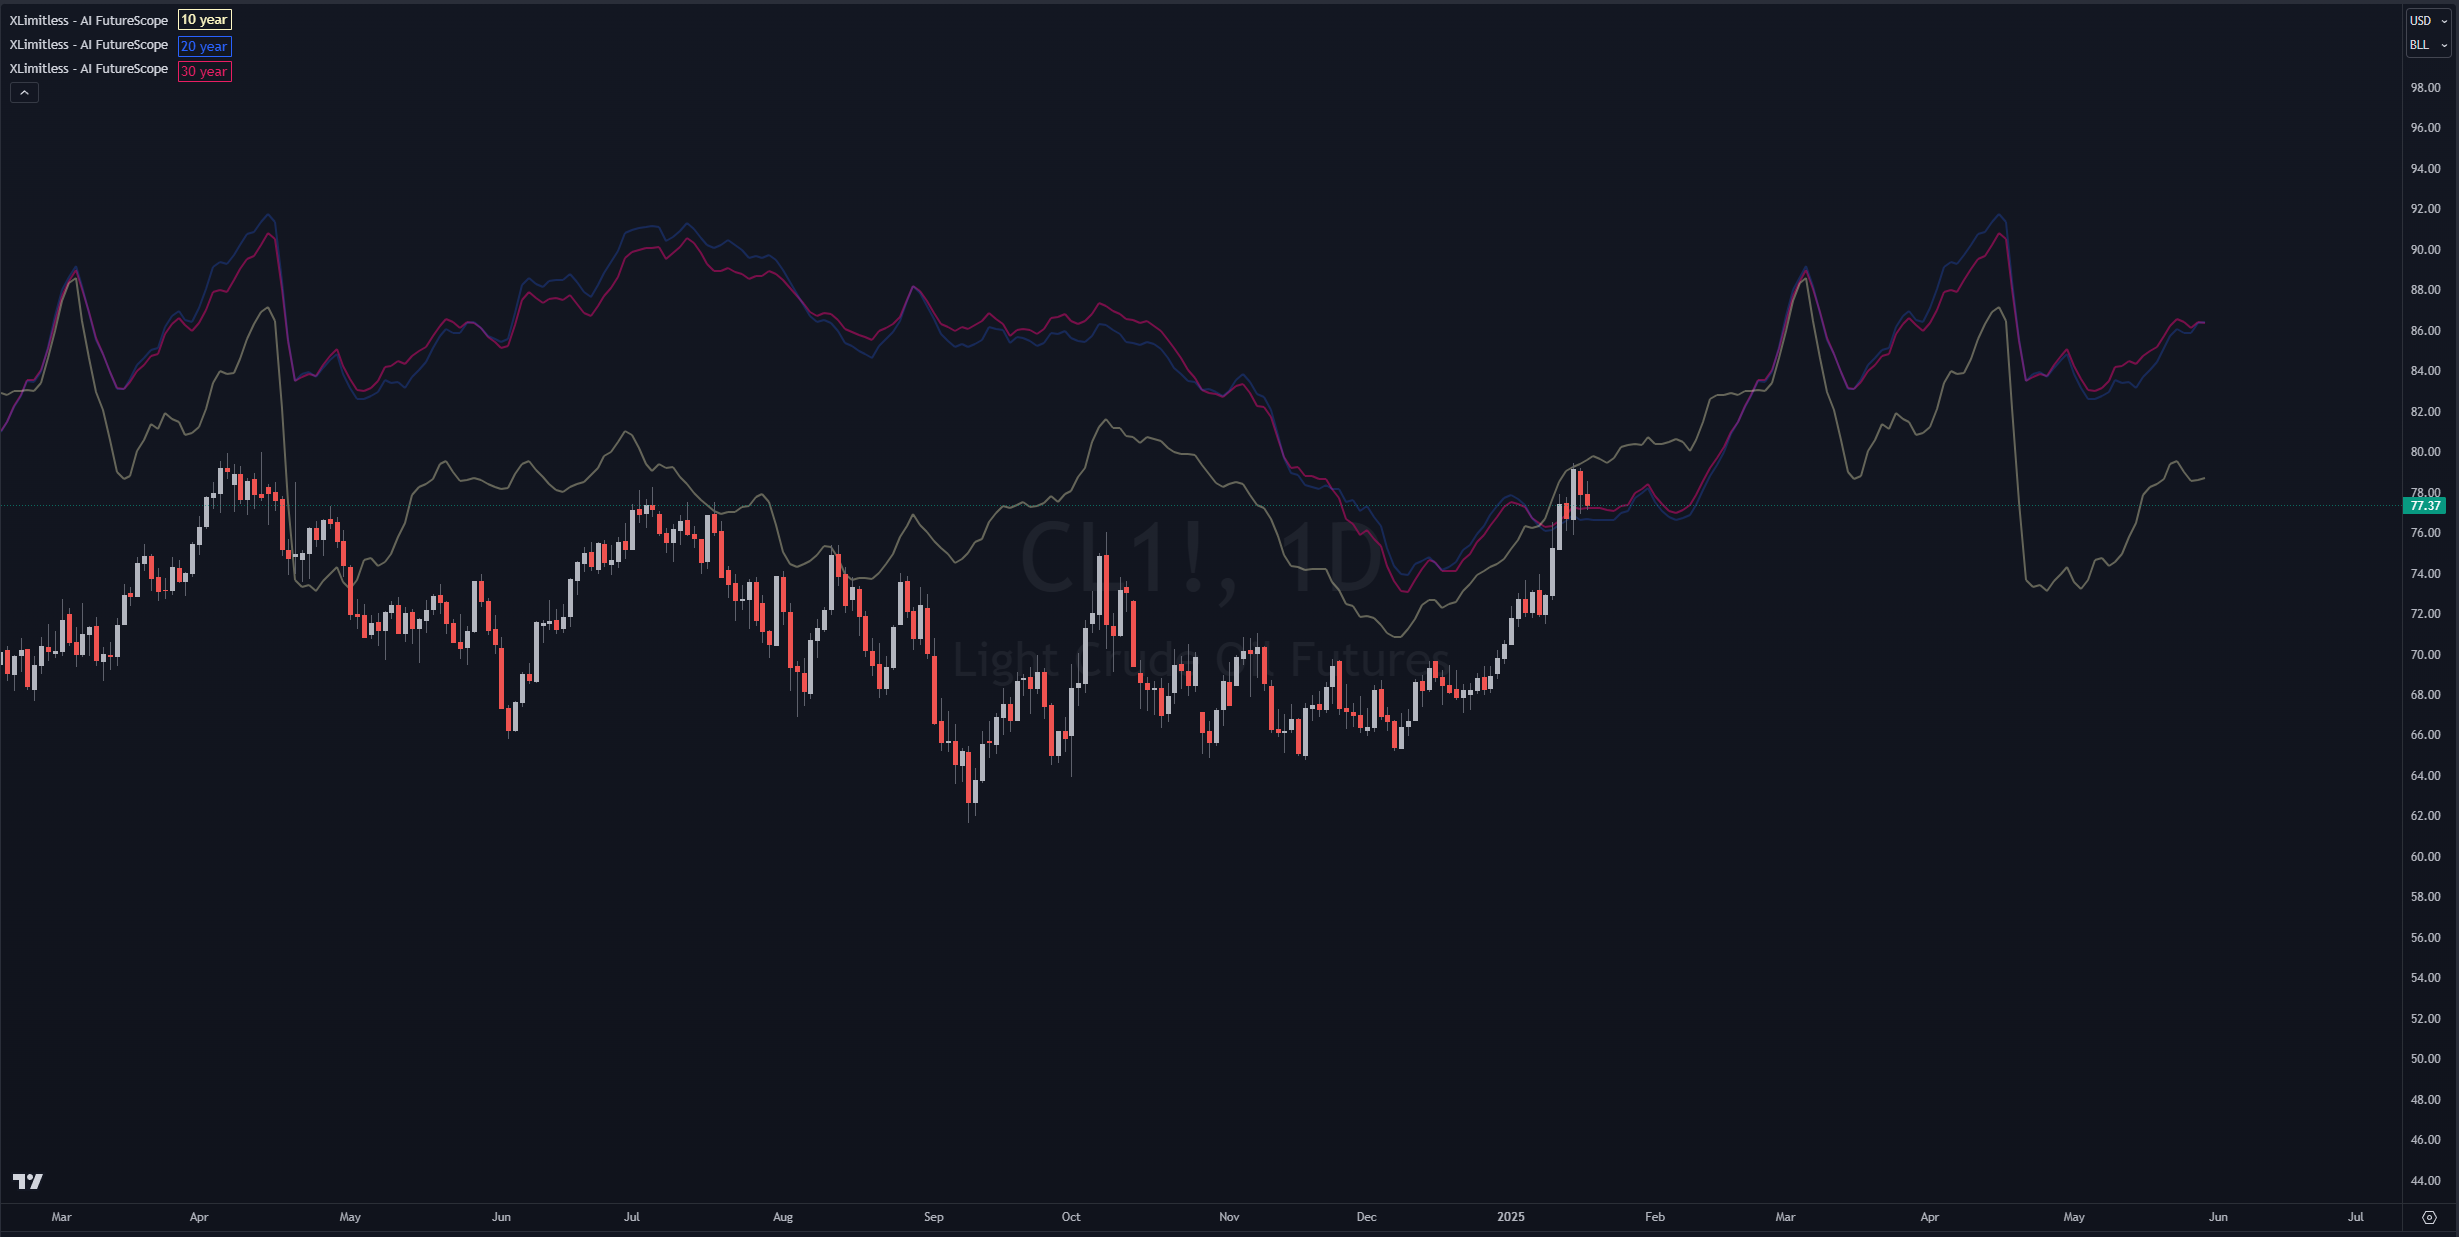
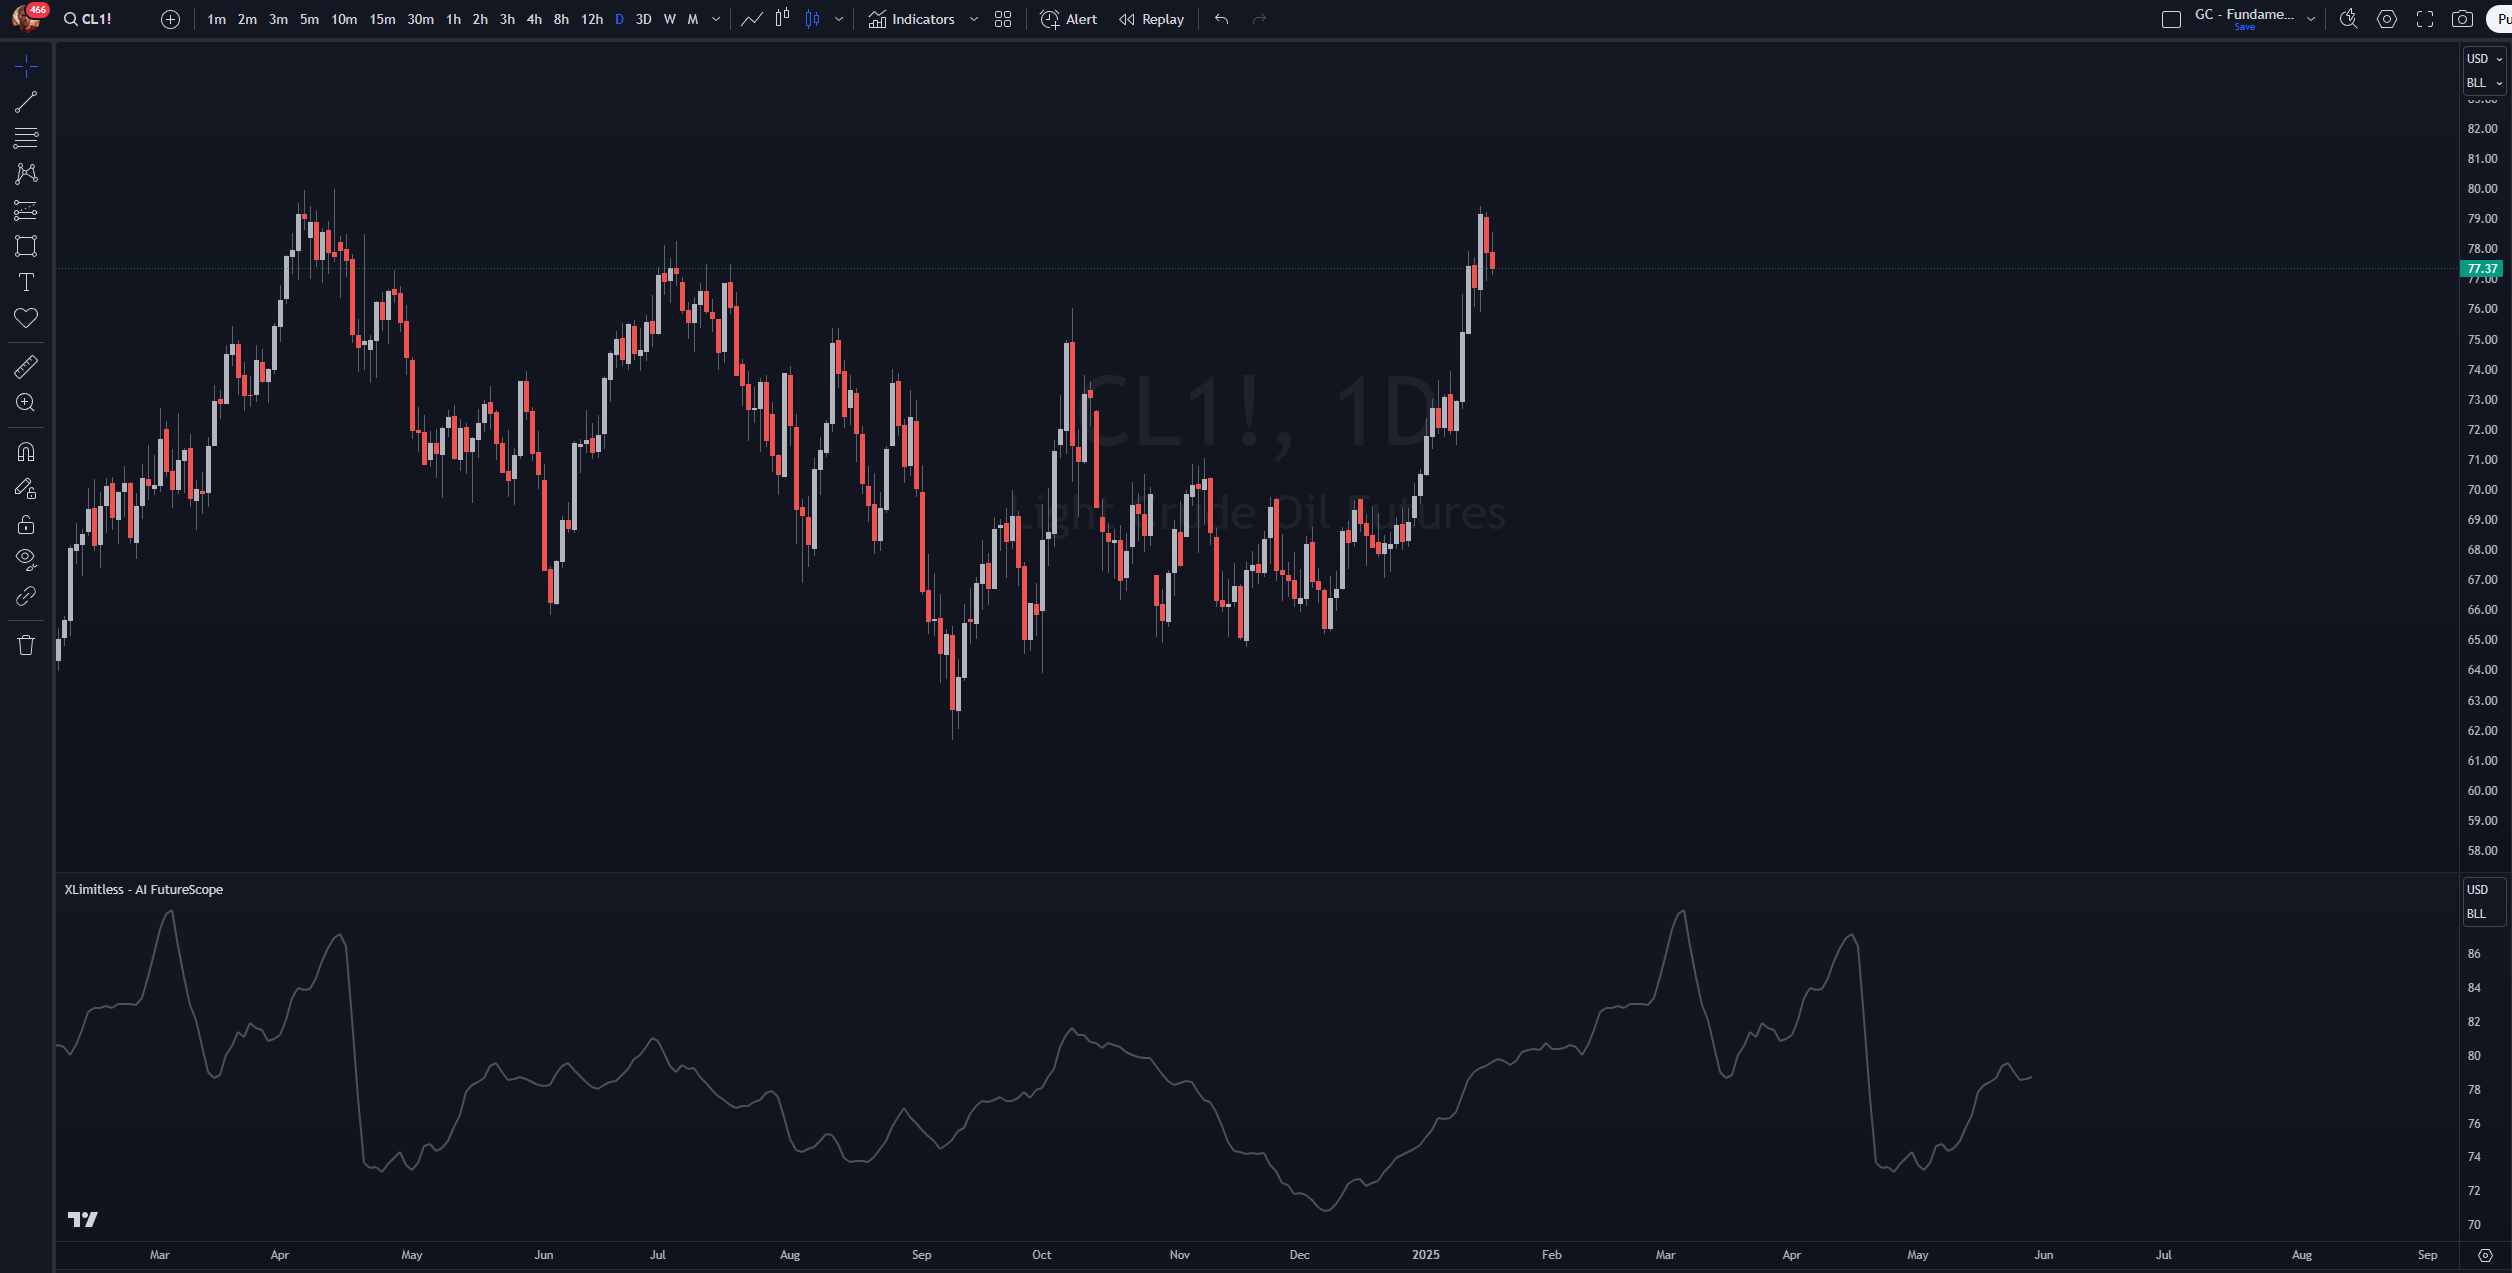
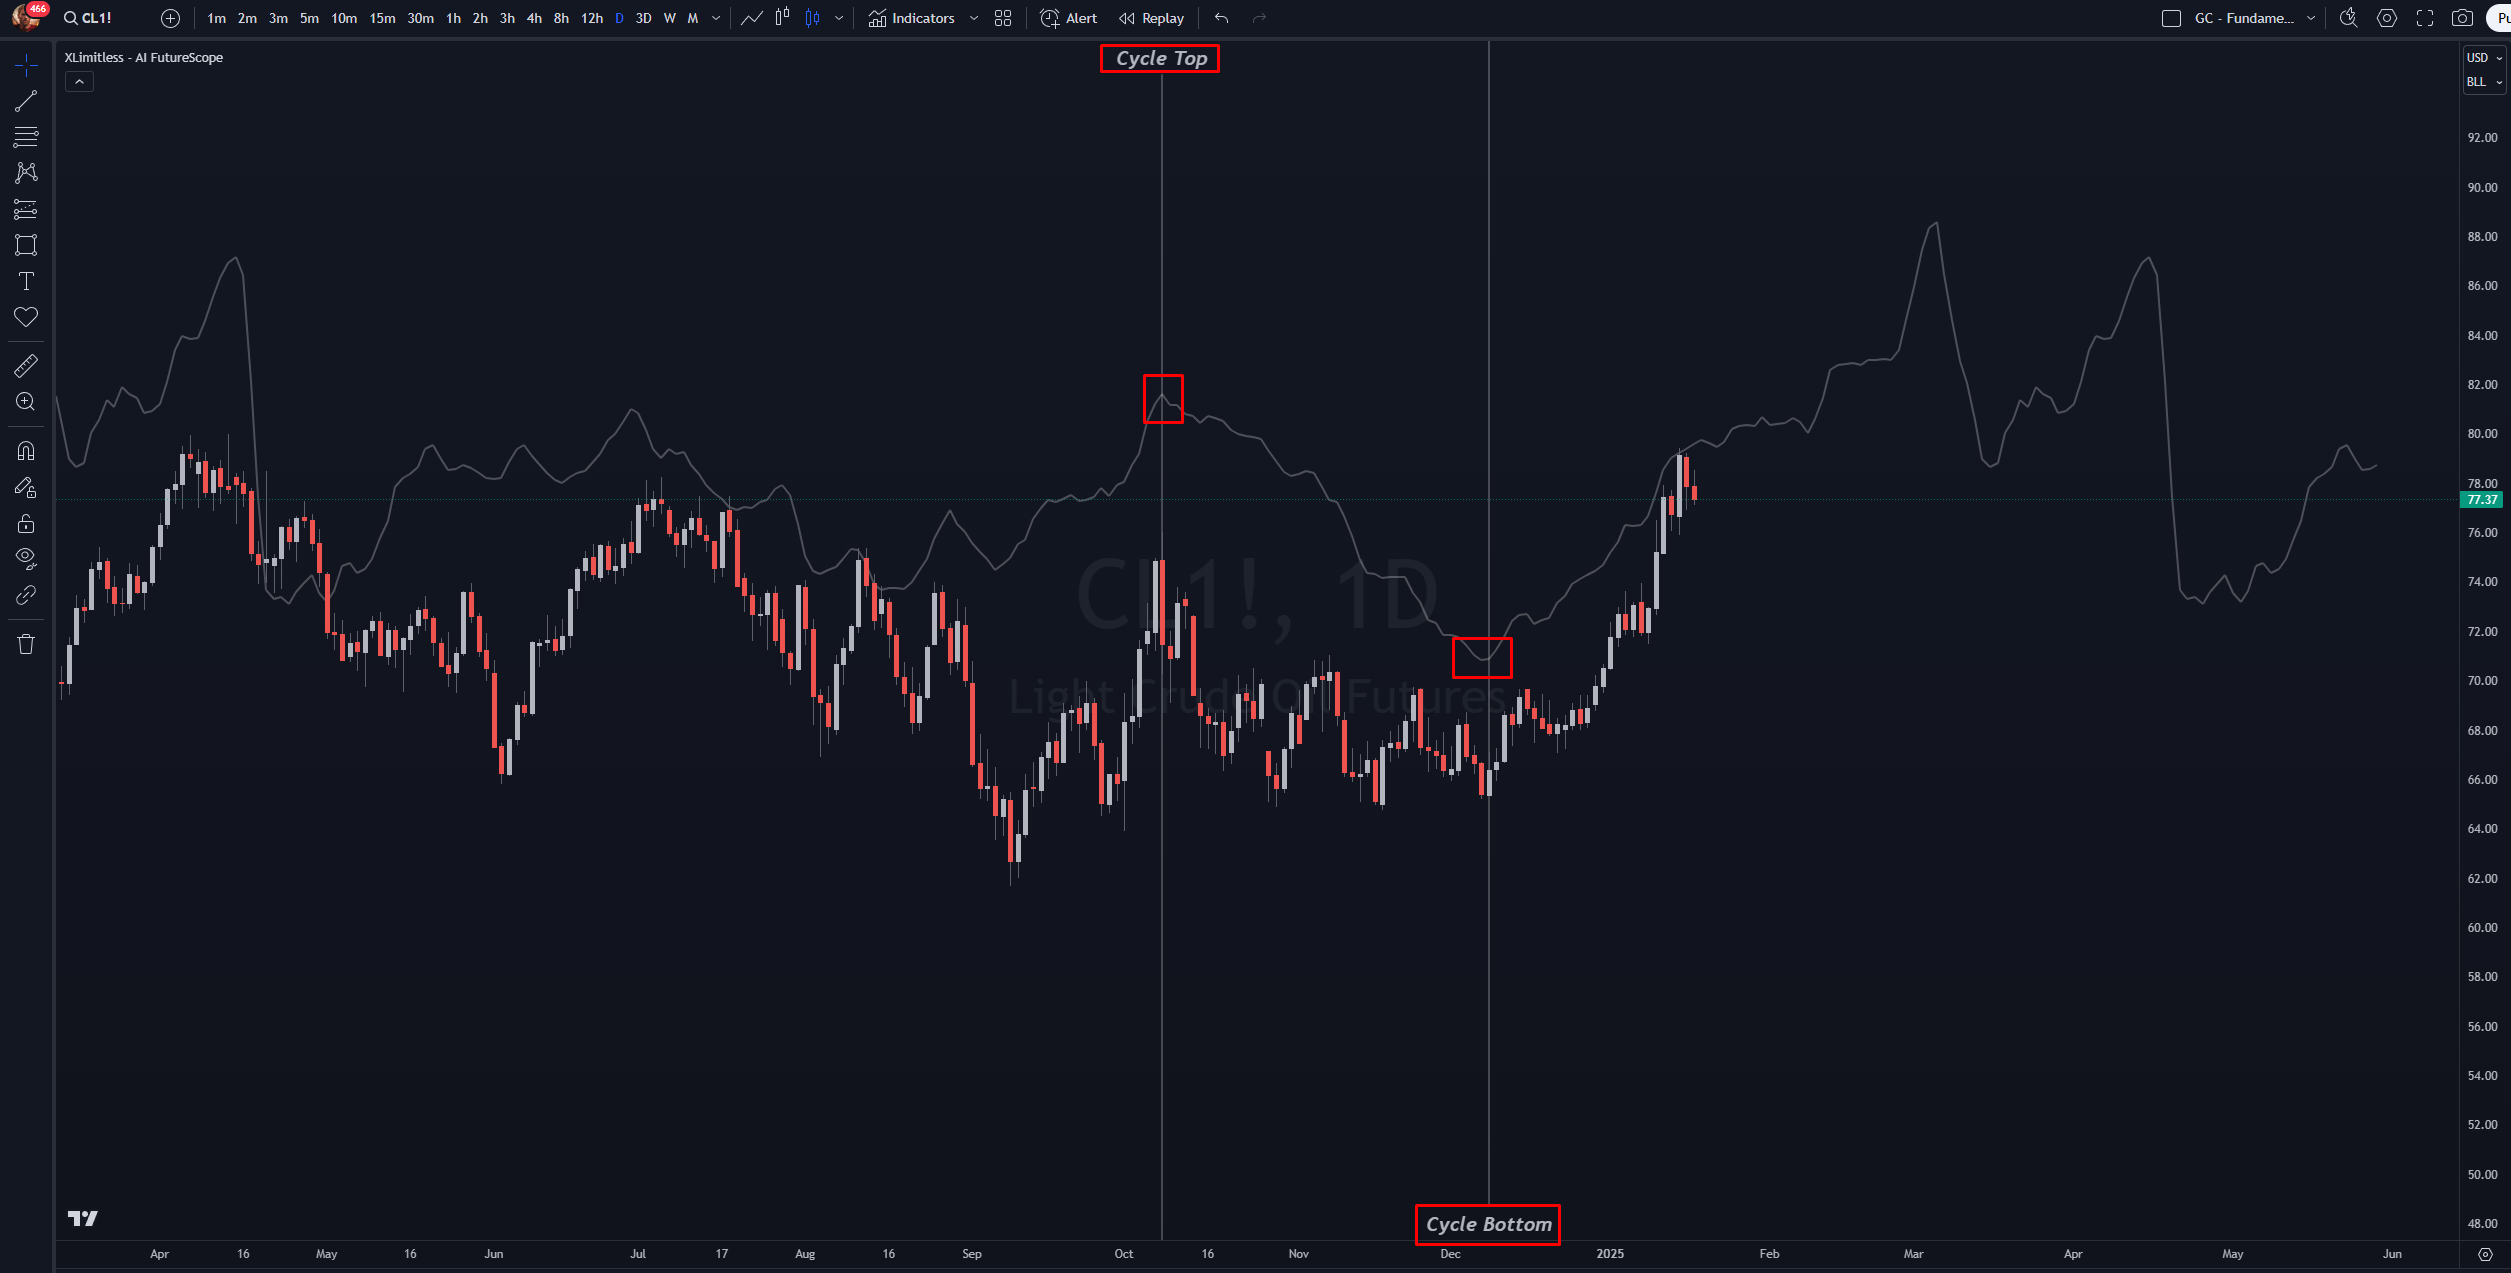
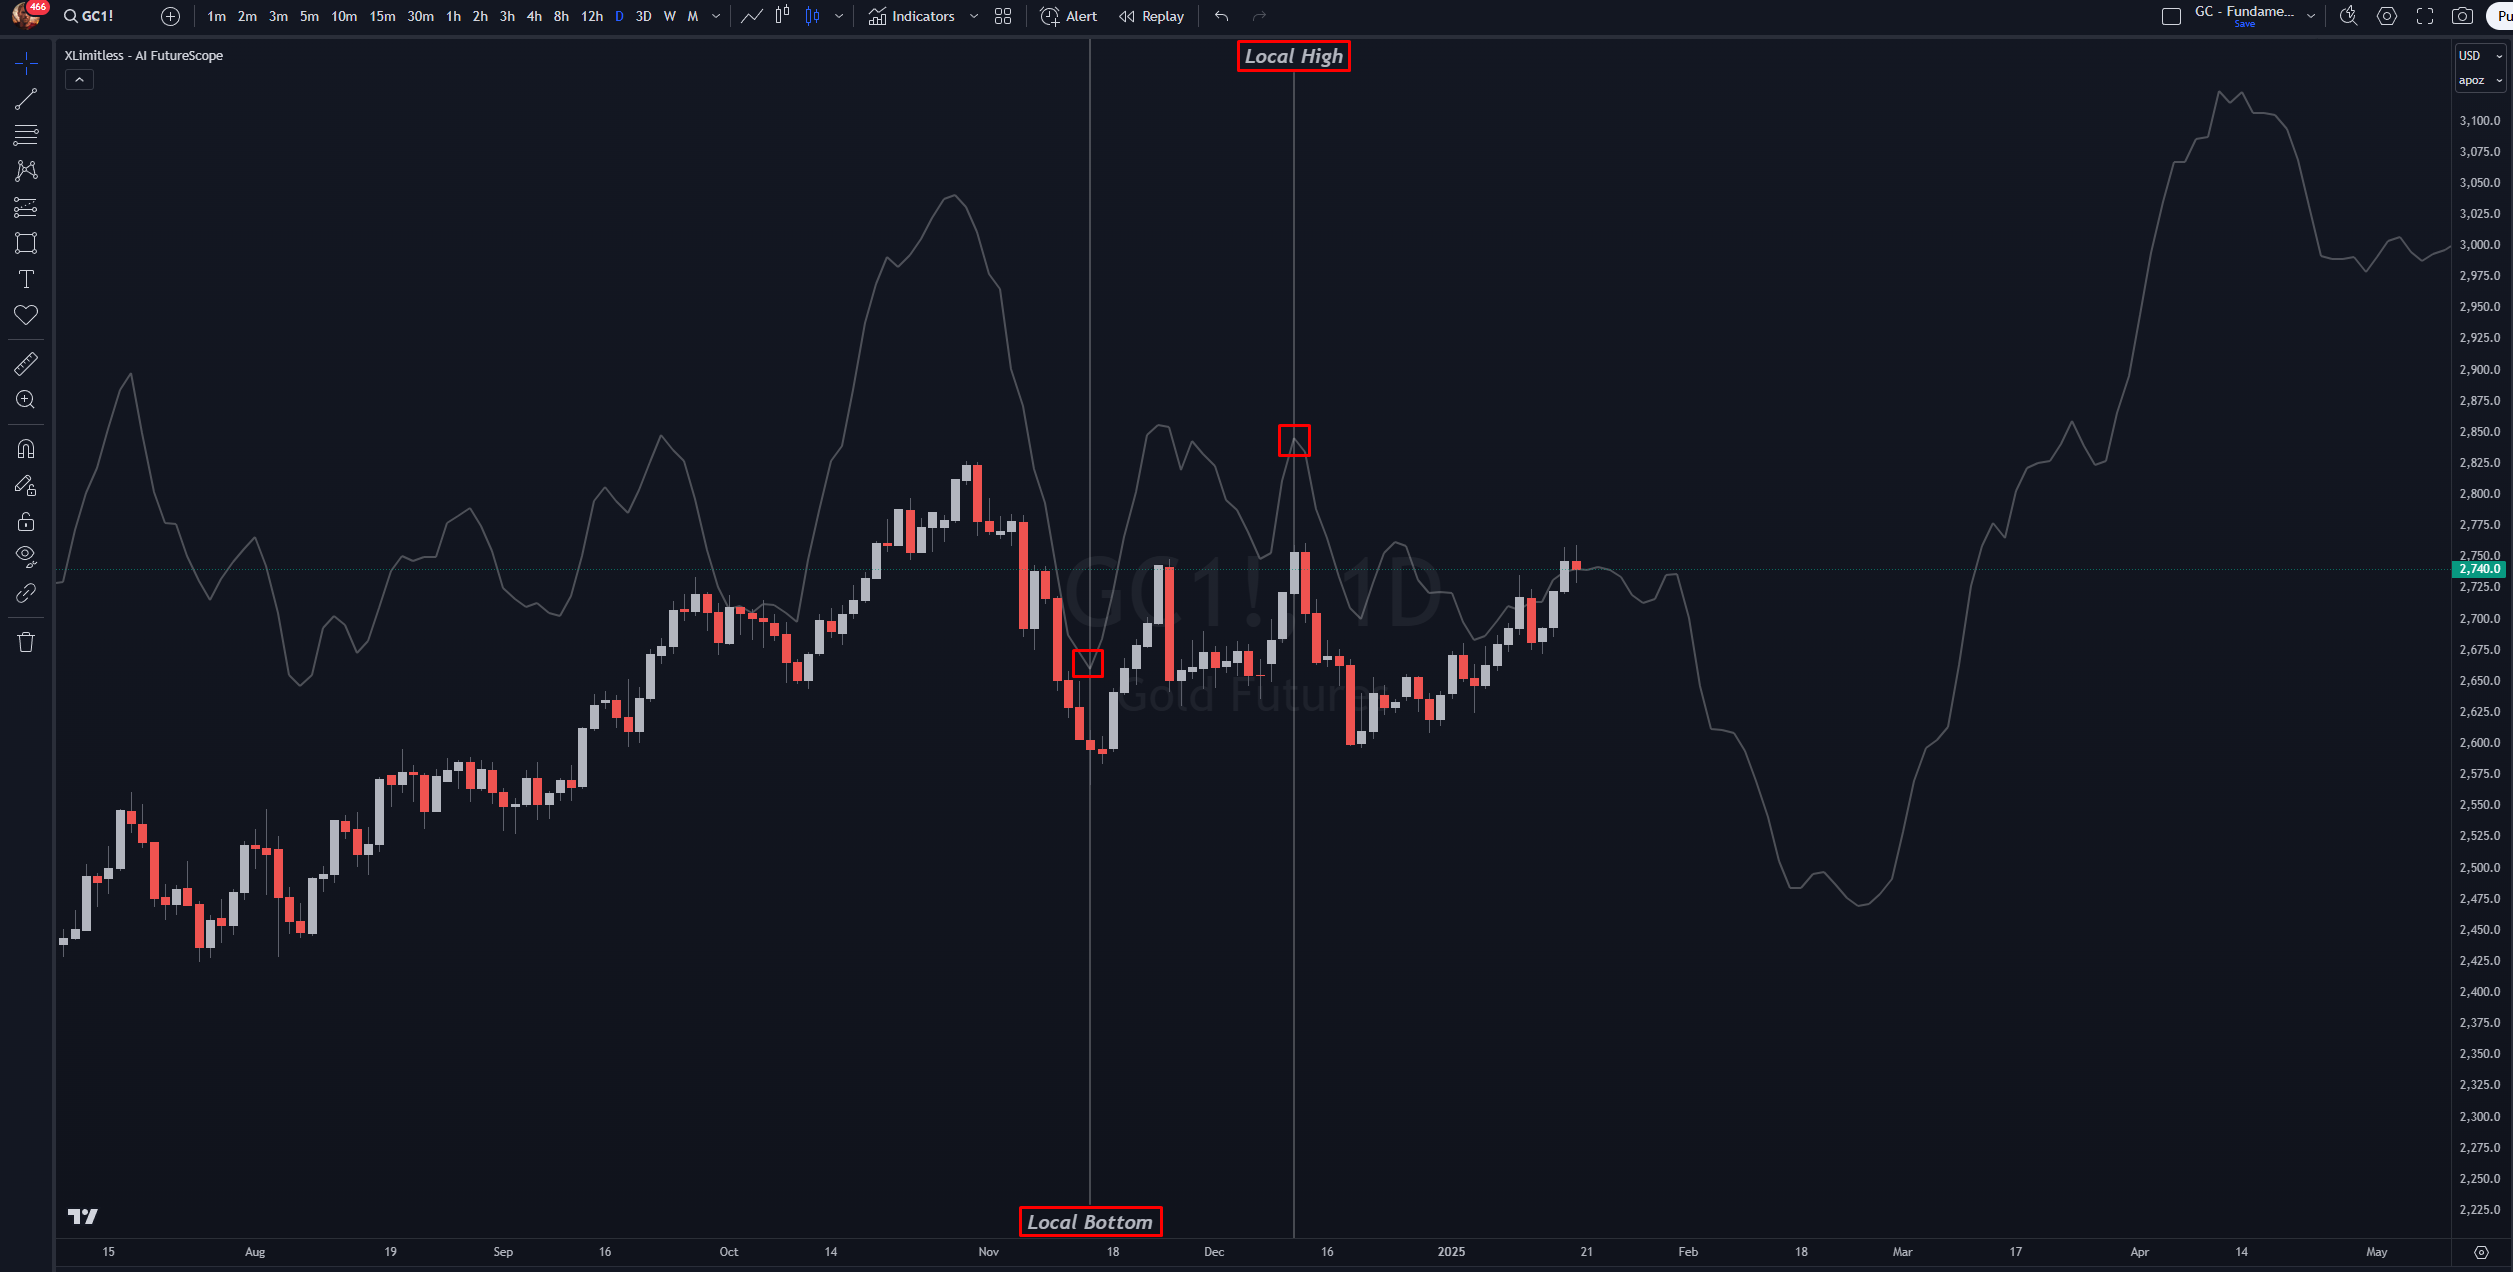
The "X Limitless - AI FutureScope" is an advanced tool that uses historical price data to project potential future trends and seasonal movements. By analyzing up to 30 years of daily trading data, it identifies potential pivots, trends, and reversals, providing traders with actionable insights into market dynamics.
1. Historical Analysis
Adding the Indicator
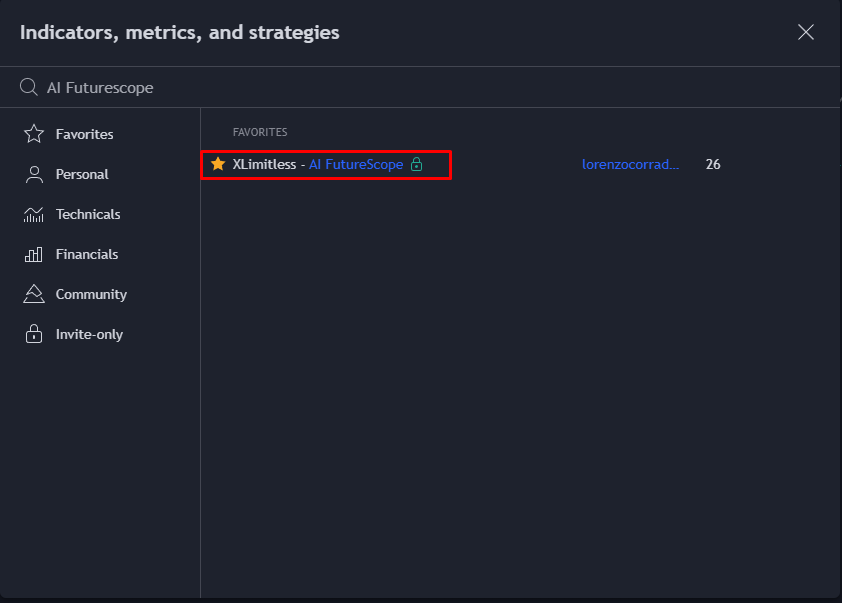
1. Open TradingView.
2. Navigate to the "Indicators" tab and click on “Invite Only”.
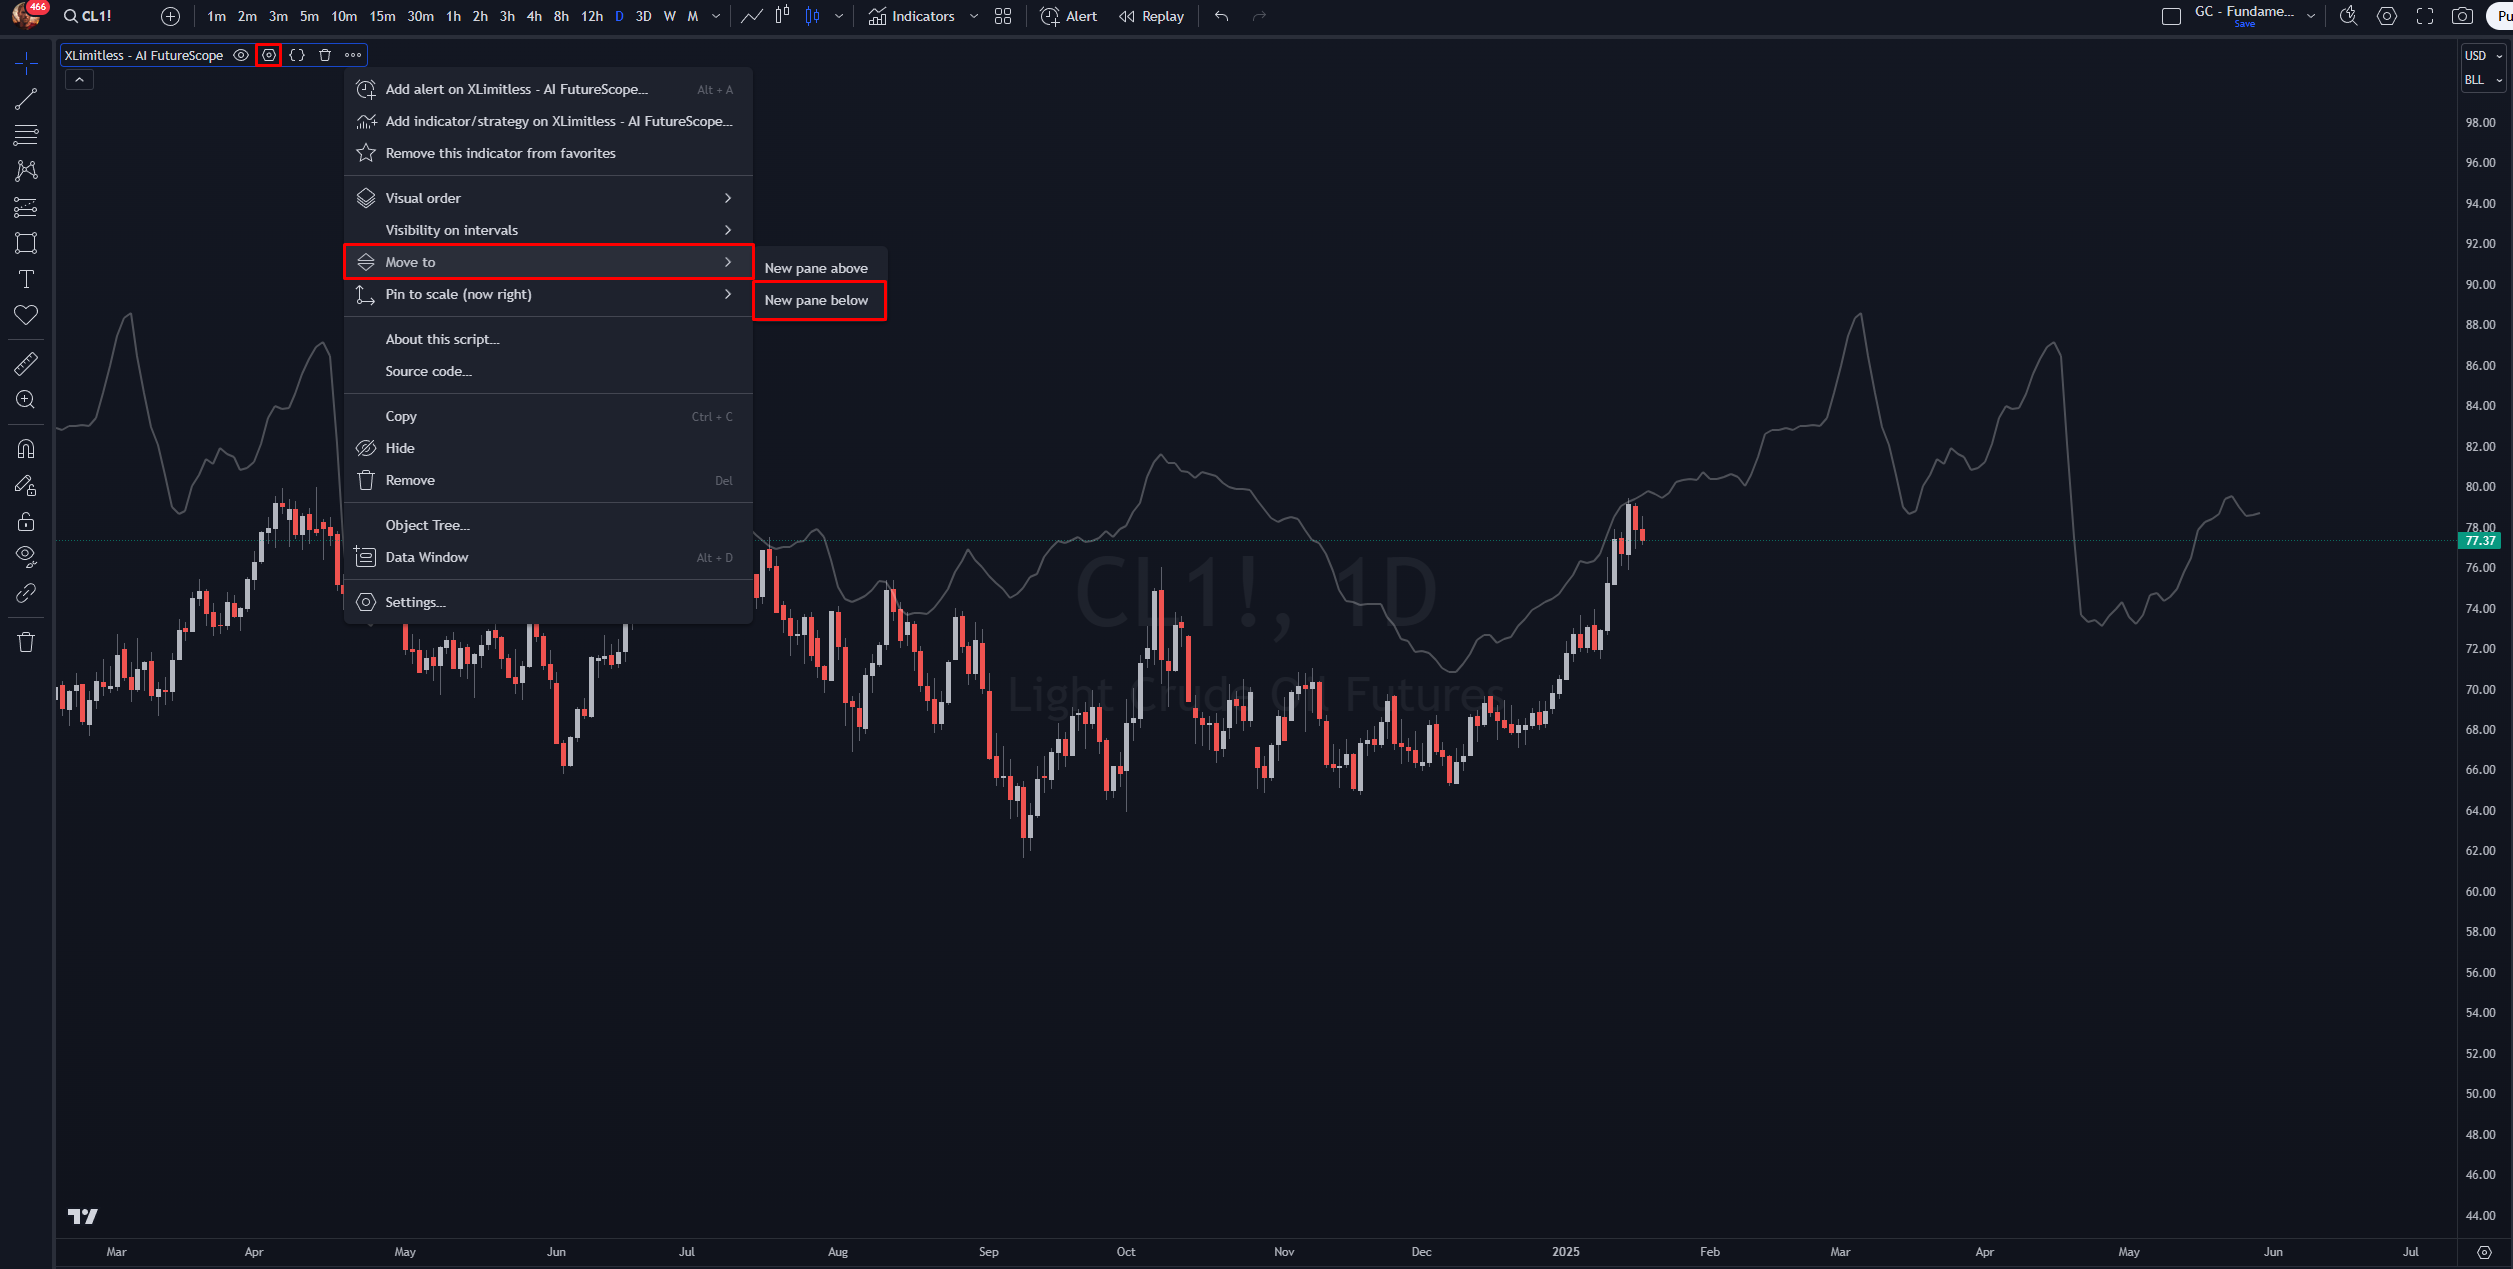
3. Search for "X Limitless - AI FutureScope" and add it to your chart or move it to a new pane.
4. Apply the Daily Timeframe
Customizing Inputs
Lookback Period in Years:

Forecast Days:
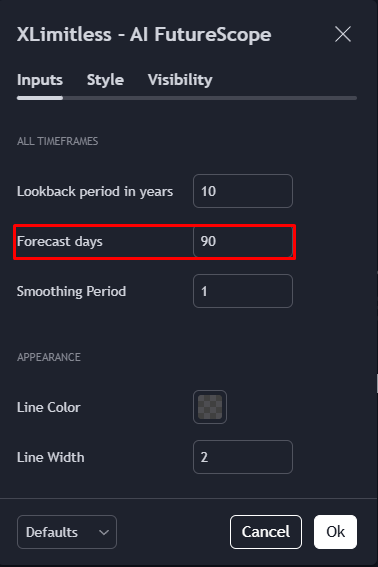
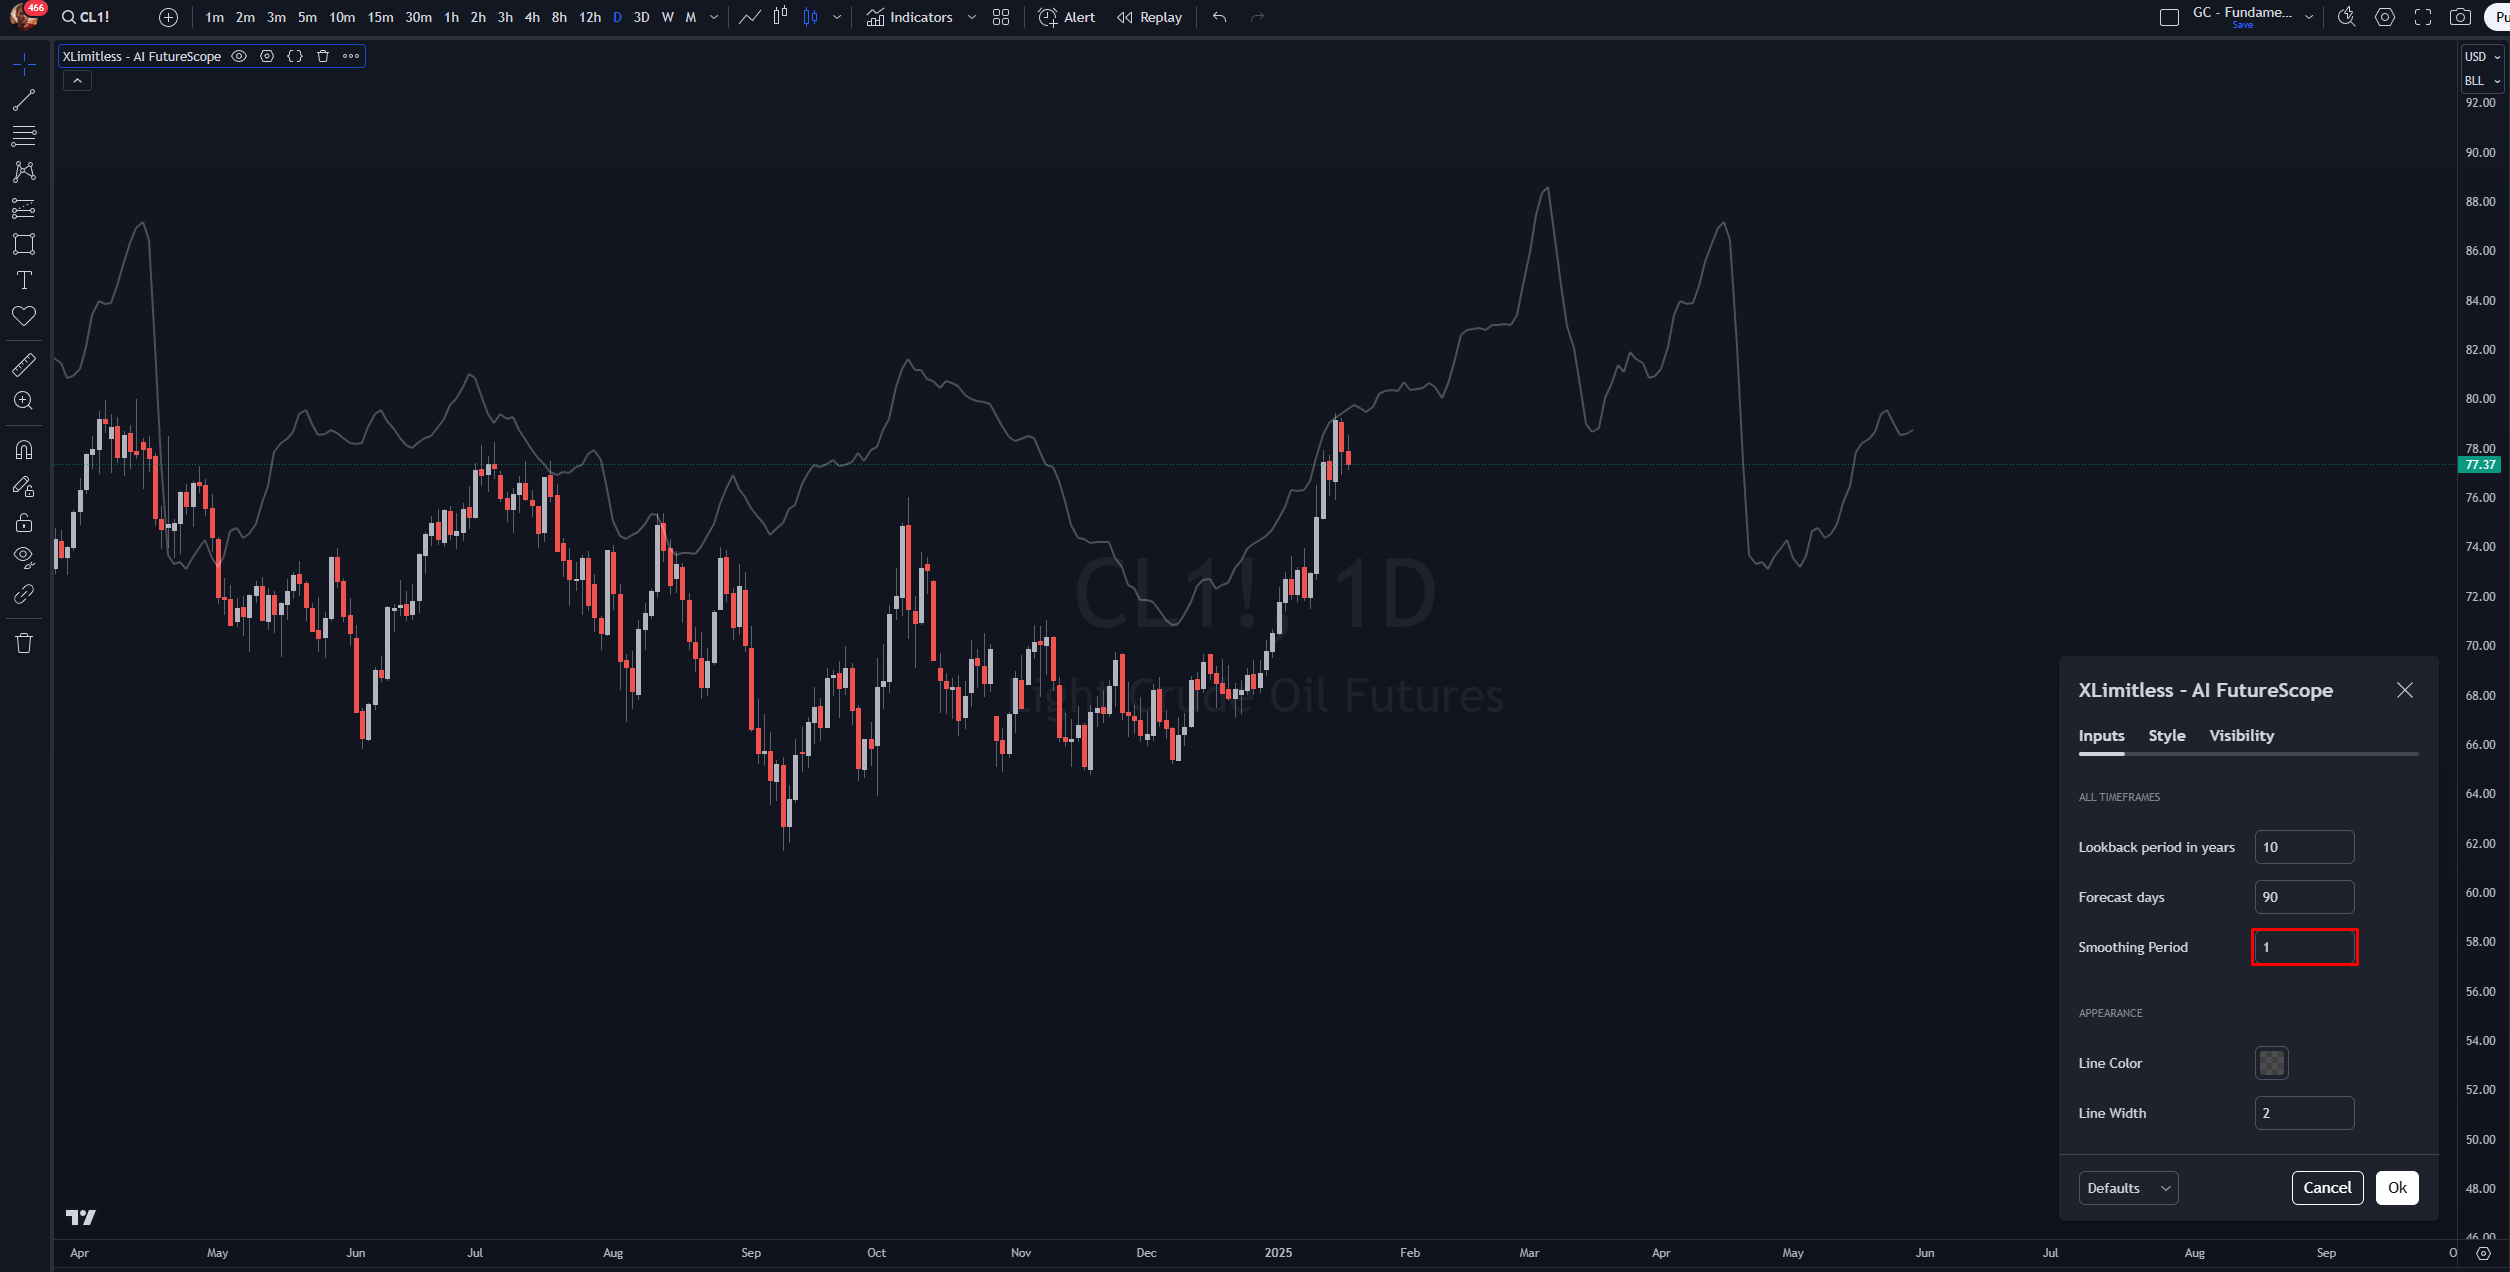
Smoothing Period:

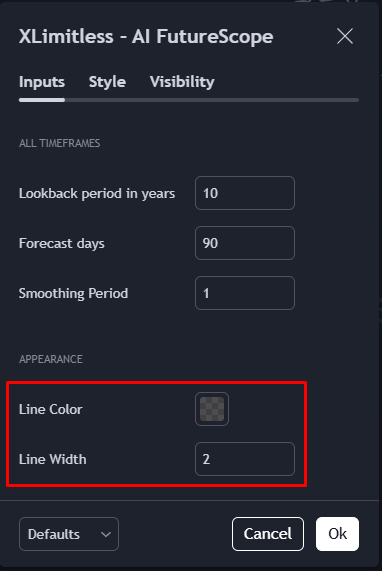
Line Color and Width:
Daily Timeframe Recommendation
Optimized for use on the daily timeframe for the most reliable results.
Data Collection
Seasonality Calculations
Trend Projections
Trend and Pivot Detection
Best Practices
1. Use on Daily Timeframe
2. Combine with Other Tools
3. Focus on Forecast Days
4. Leverage Pivots
1. Why are some lines missing?
2. Can I use the indicator for daily or weekly timeframes?
3. How do I interpret the "Smoothing Period"?
4. How does the indicator handle assets with limited historical data?
Disclaimer
The AI FutureScope is a powerful tool designed to assist in analyzing historical trends and projecting potential future movements; however, it is not a guarantee of future performance or market behavior. Trading involves substantial risk, and the projections provided by this tool are based on historical data, which may not account for unexpected market conditions or events. Always use this indicator in conjunction with other analysis methods, and conduct your own due diligence before making any investment decisions. The user assumes full responsibility for their trading actions and associated risks.
