Indicators

X Limitless - NetEdge™ Indicator (COT)

Stop guessing and look behind the charts. With the NetEdge™ you get access to institutional and retail traders’ net positions so you can track smart money flows and align your trades with the professionals.

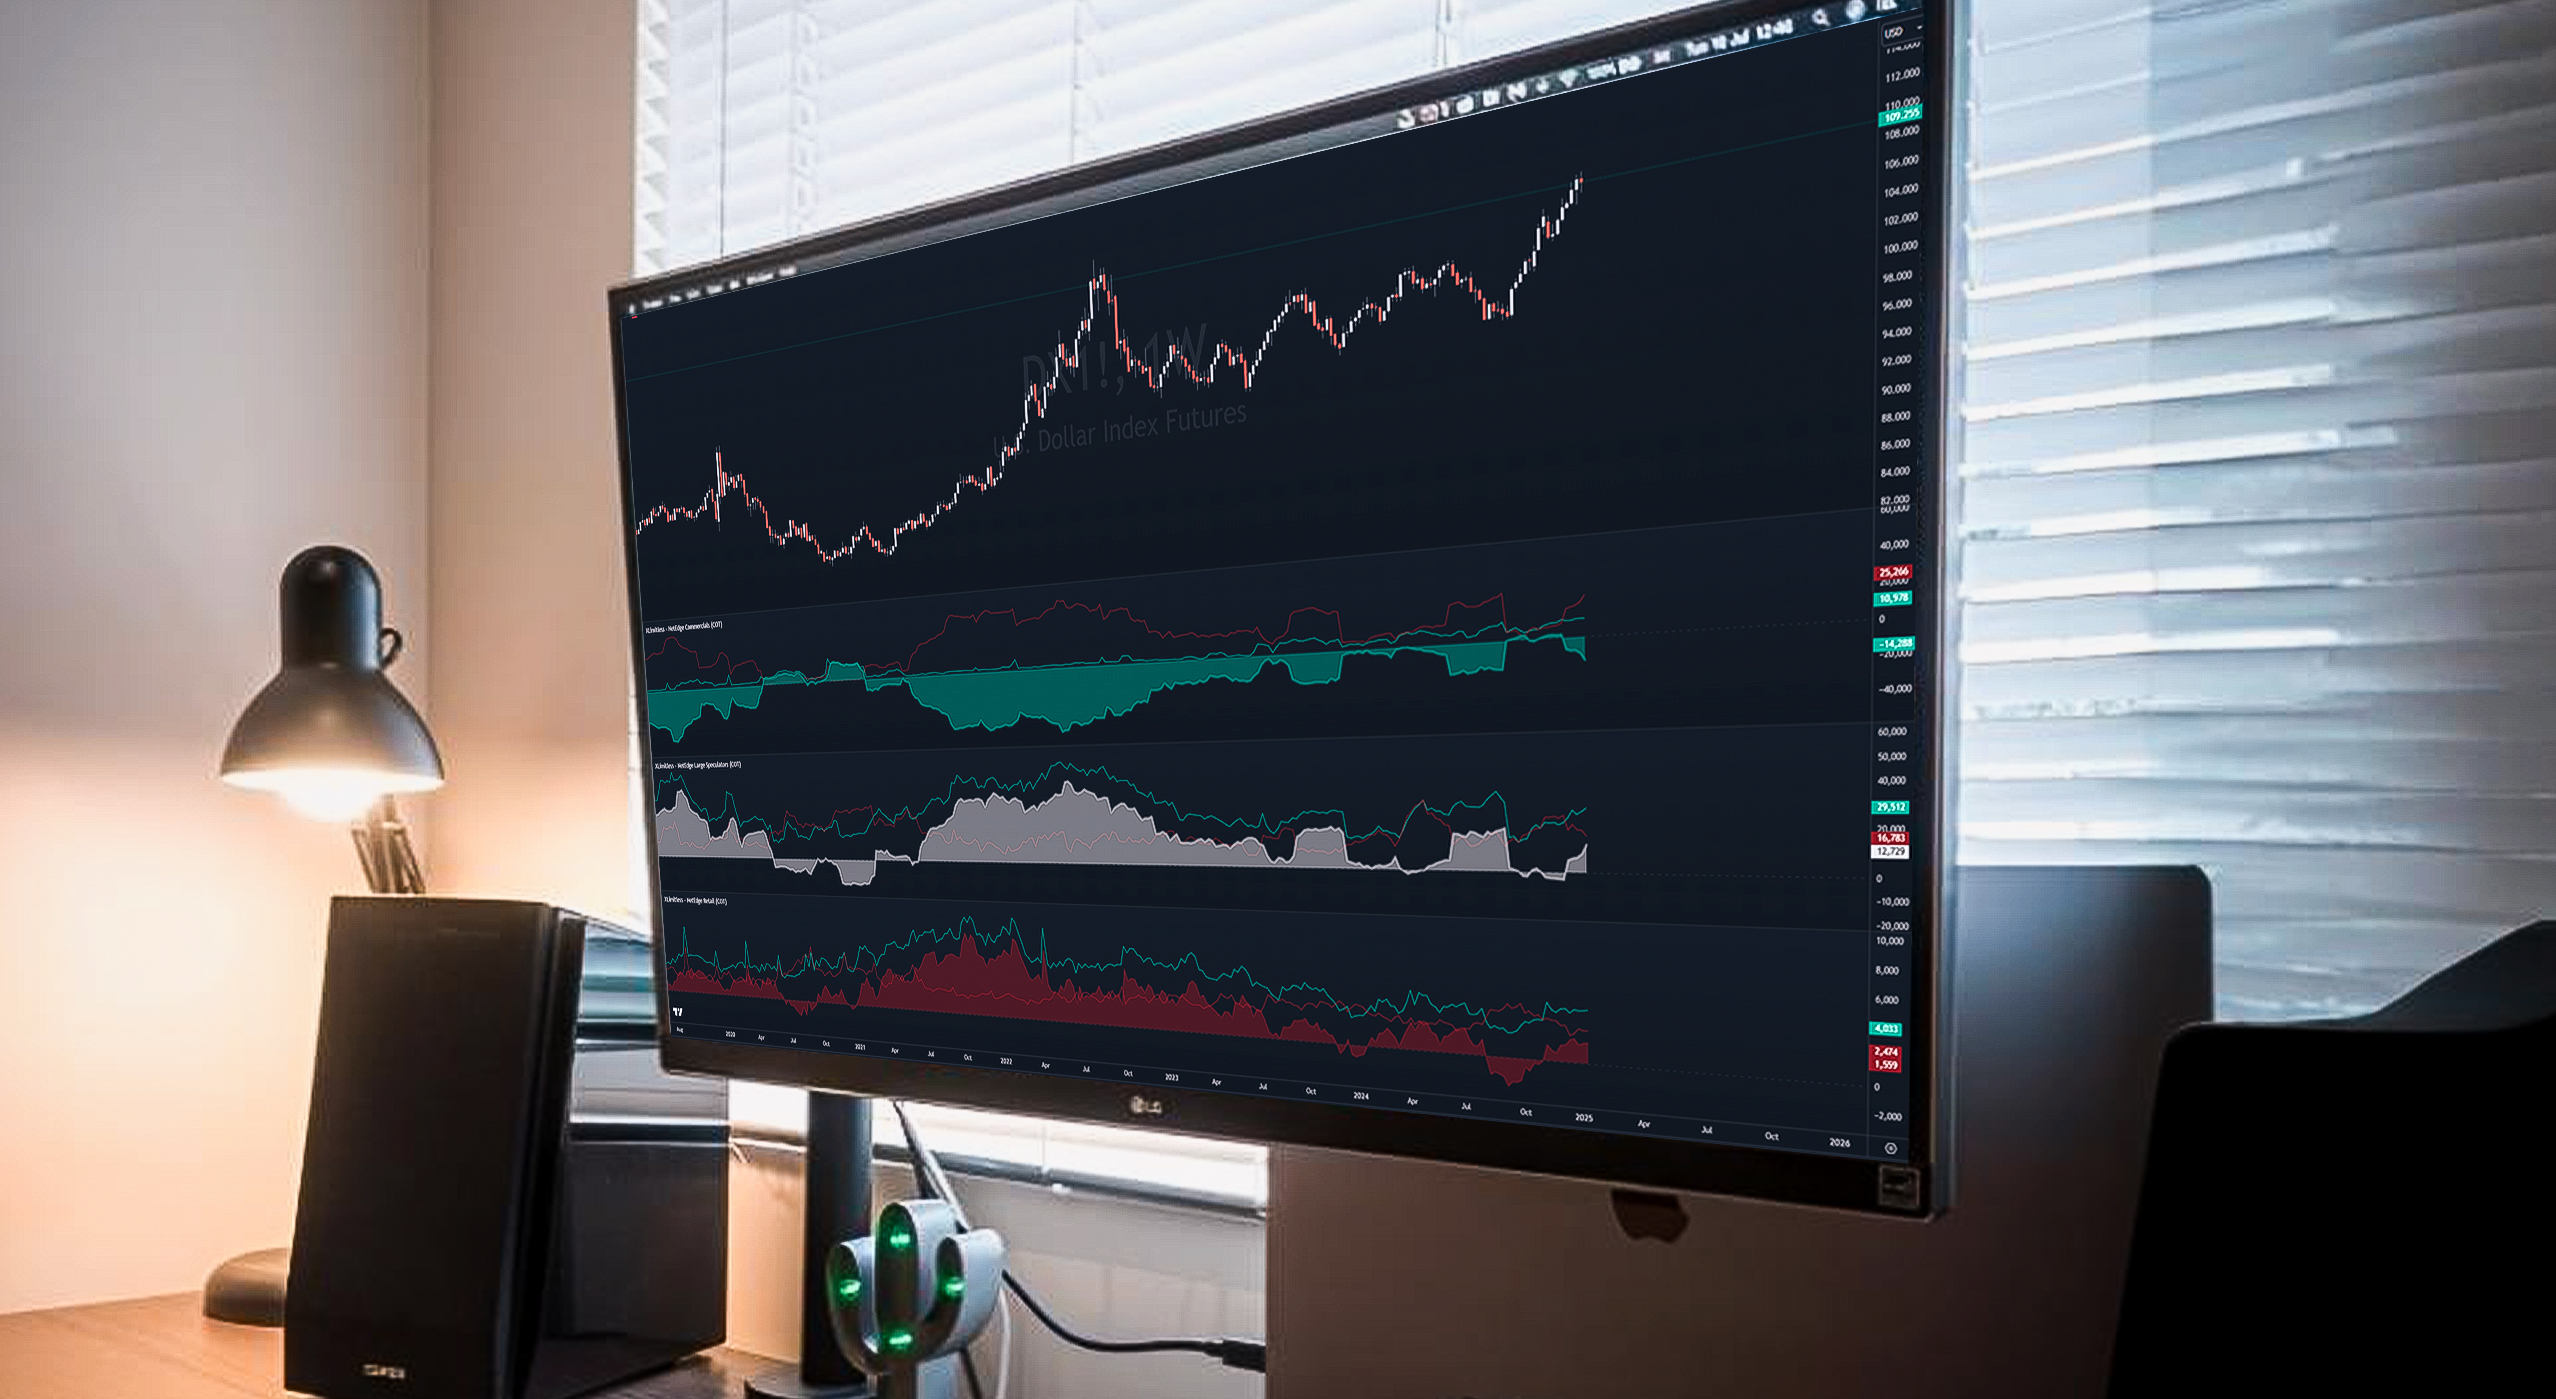
The "XLimitless - NetEdge Indicators (COT)" series provides a granular view of market positioning by focusing on three key market participant groups:

  1. Retail Traders (Non-Reportables): Tracks the net long, short, and overall net positions of small retail participants.
  2. Large Speculators (Non-Commercials): Highlights speculative positions taken by institutional players such as Banks, Hedge Funds and Large Traders.
  3. Commercials (Users & Producers): Displays hedging activities by entities that use the asset for business purposes.

Each indicator in this series is designed to help traders gauge the sentiment of these participant groups and identify potential market extremes.

Indicators Overview

1. X Limitless - NetEdge Retail (COT)

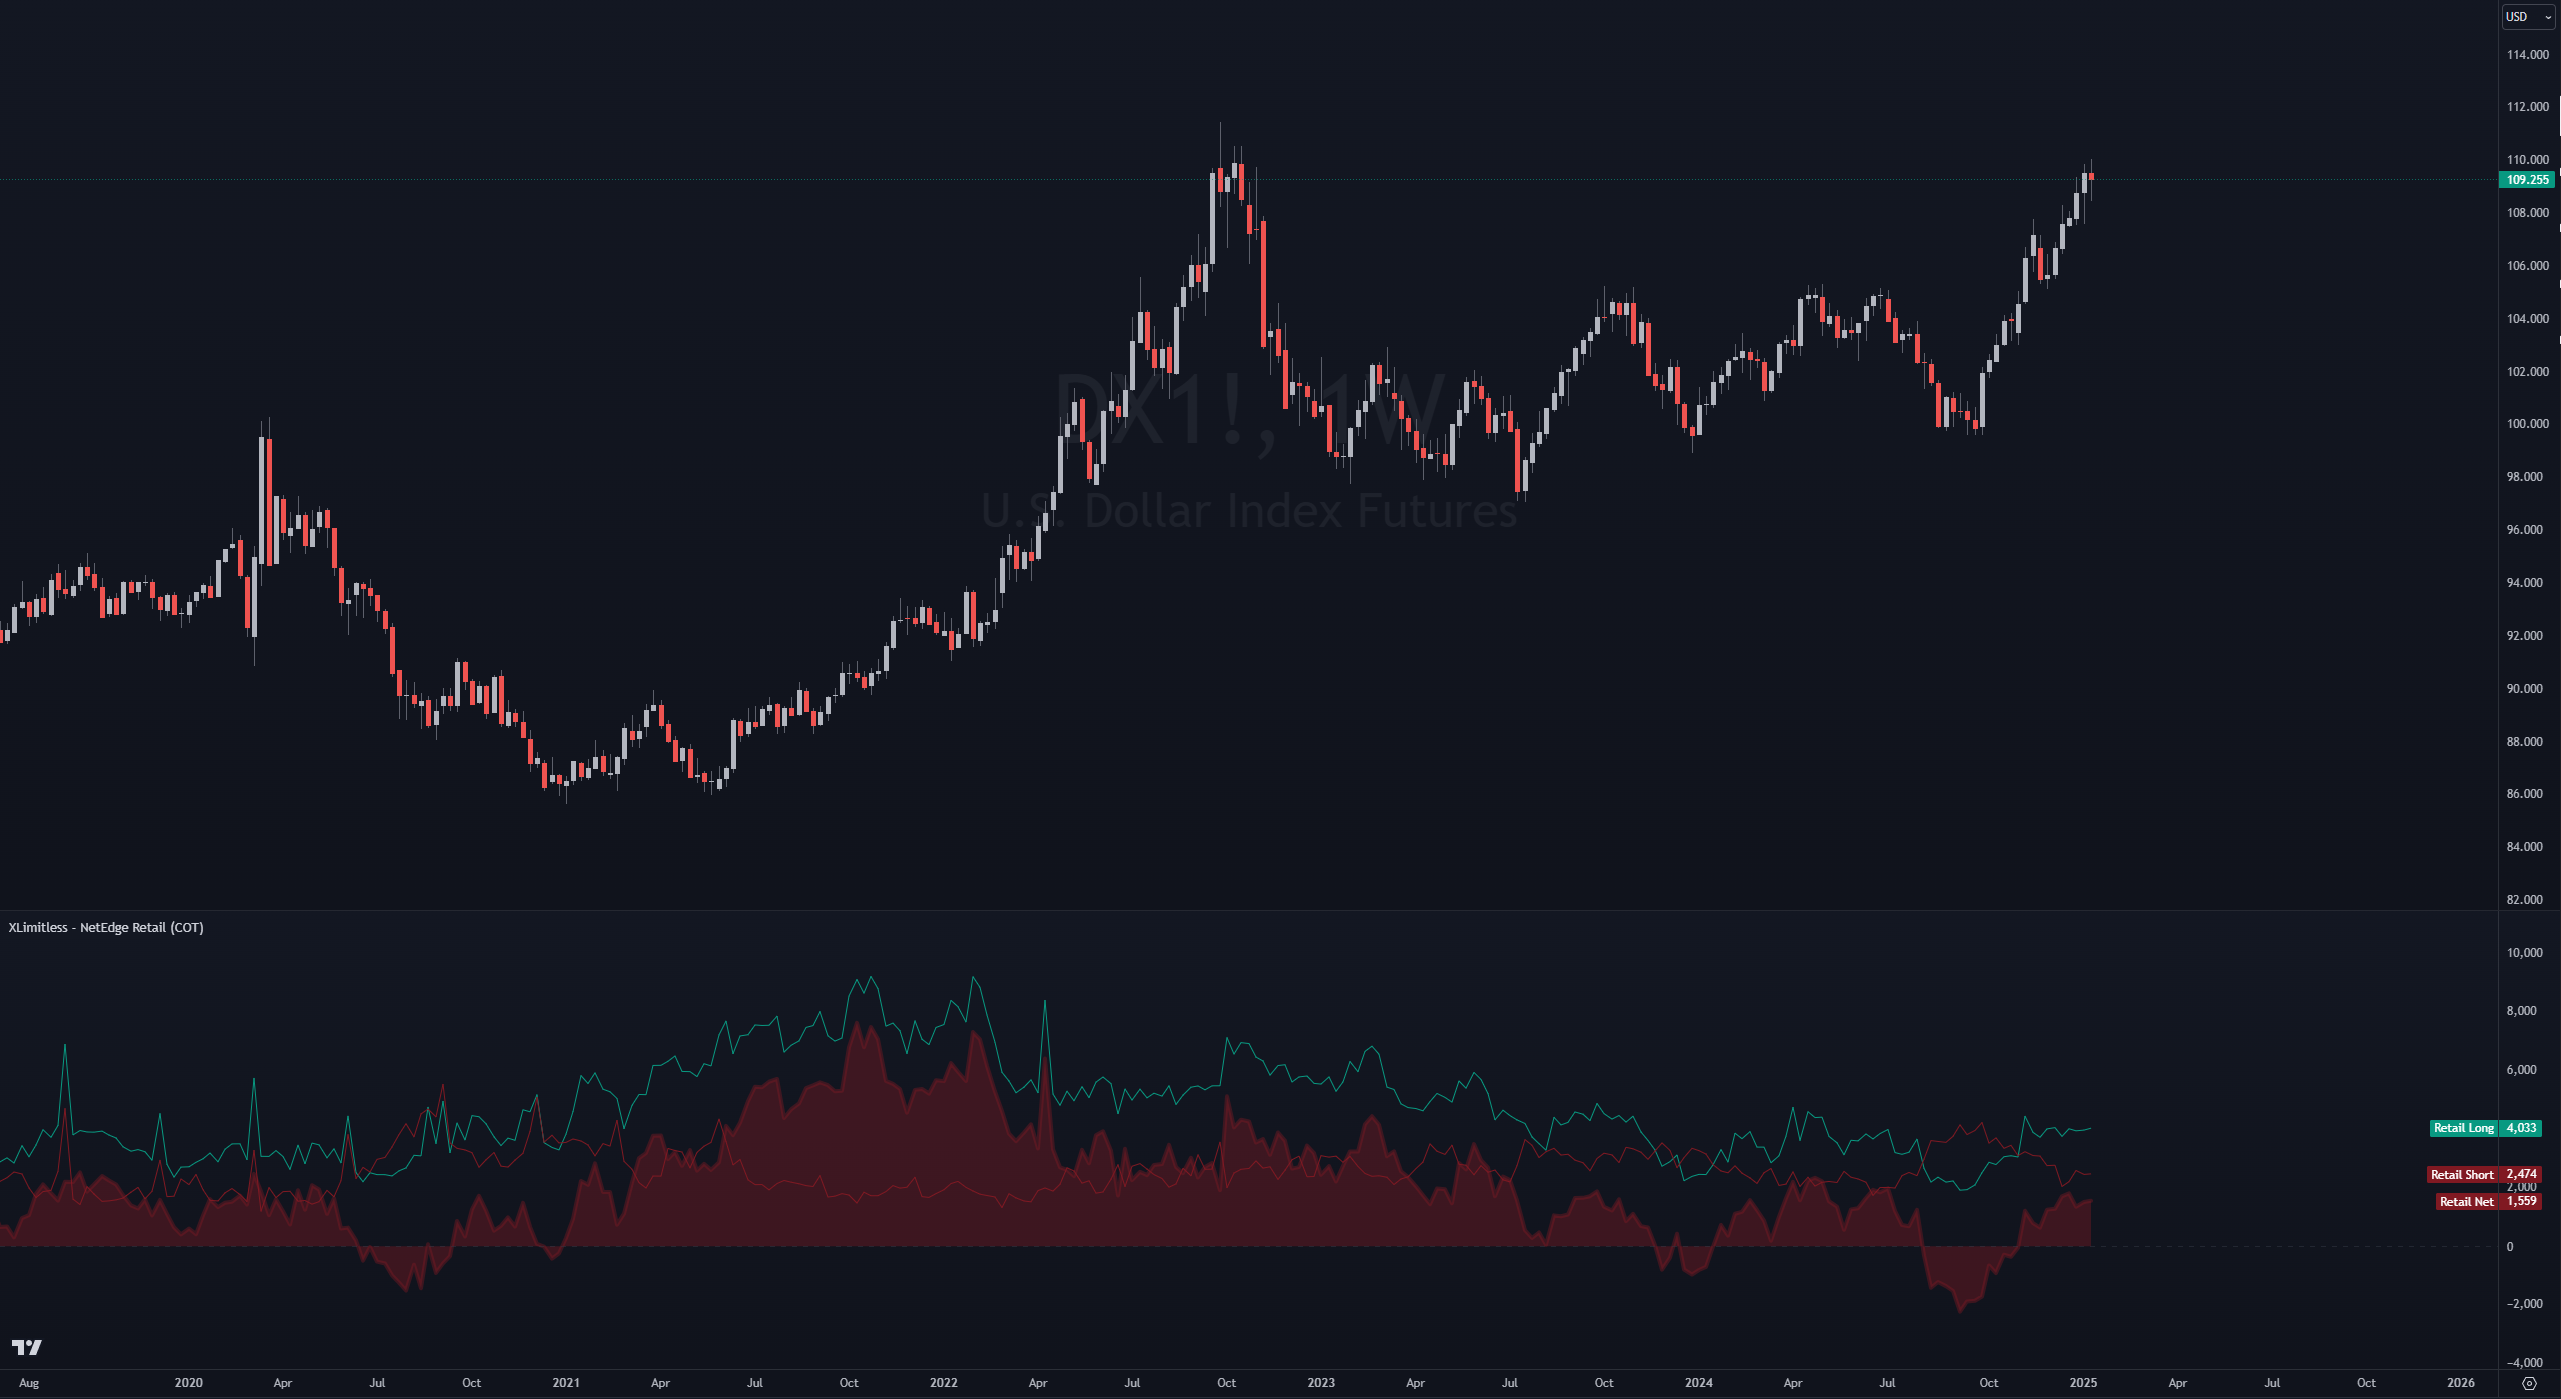
Purpose: Analyzes retail trader sentiment by plotting long, short, and net positions.

Key features:

  • Displays long positions (green line).
  • Displays short positions (red line).
  • Displays net positions (shaded area in red).
  • Zero line for reference to indicate net neutrality.

Best use case: Identify when retail traders are overly biased in one direction to anticipate reversals.

2. X Limitless - NetEdge Large Speculators (COT)

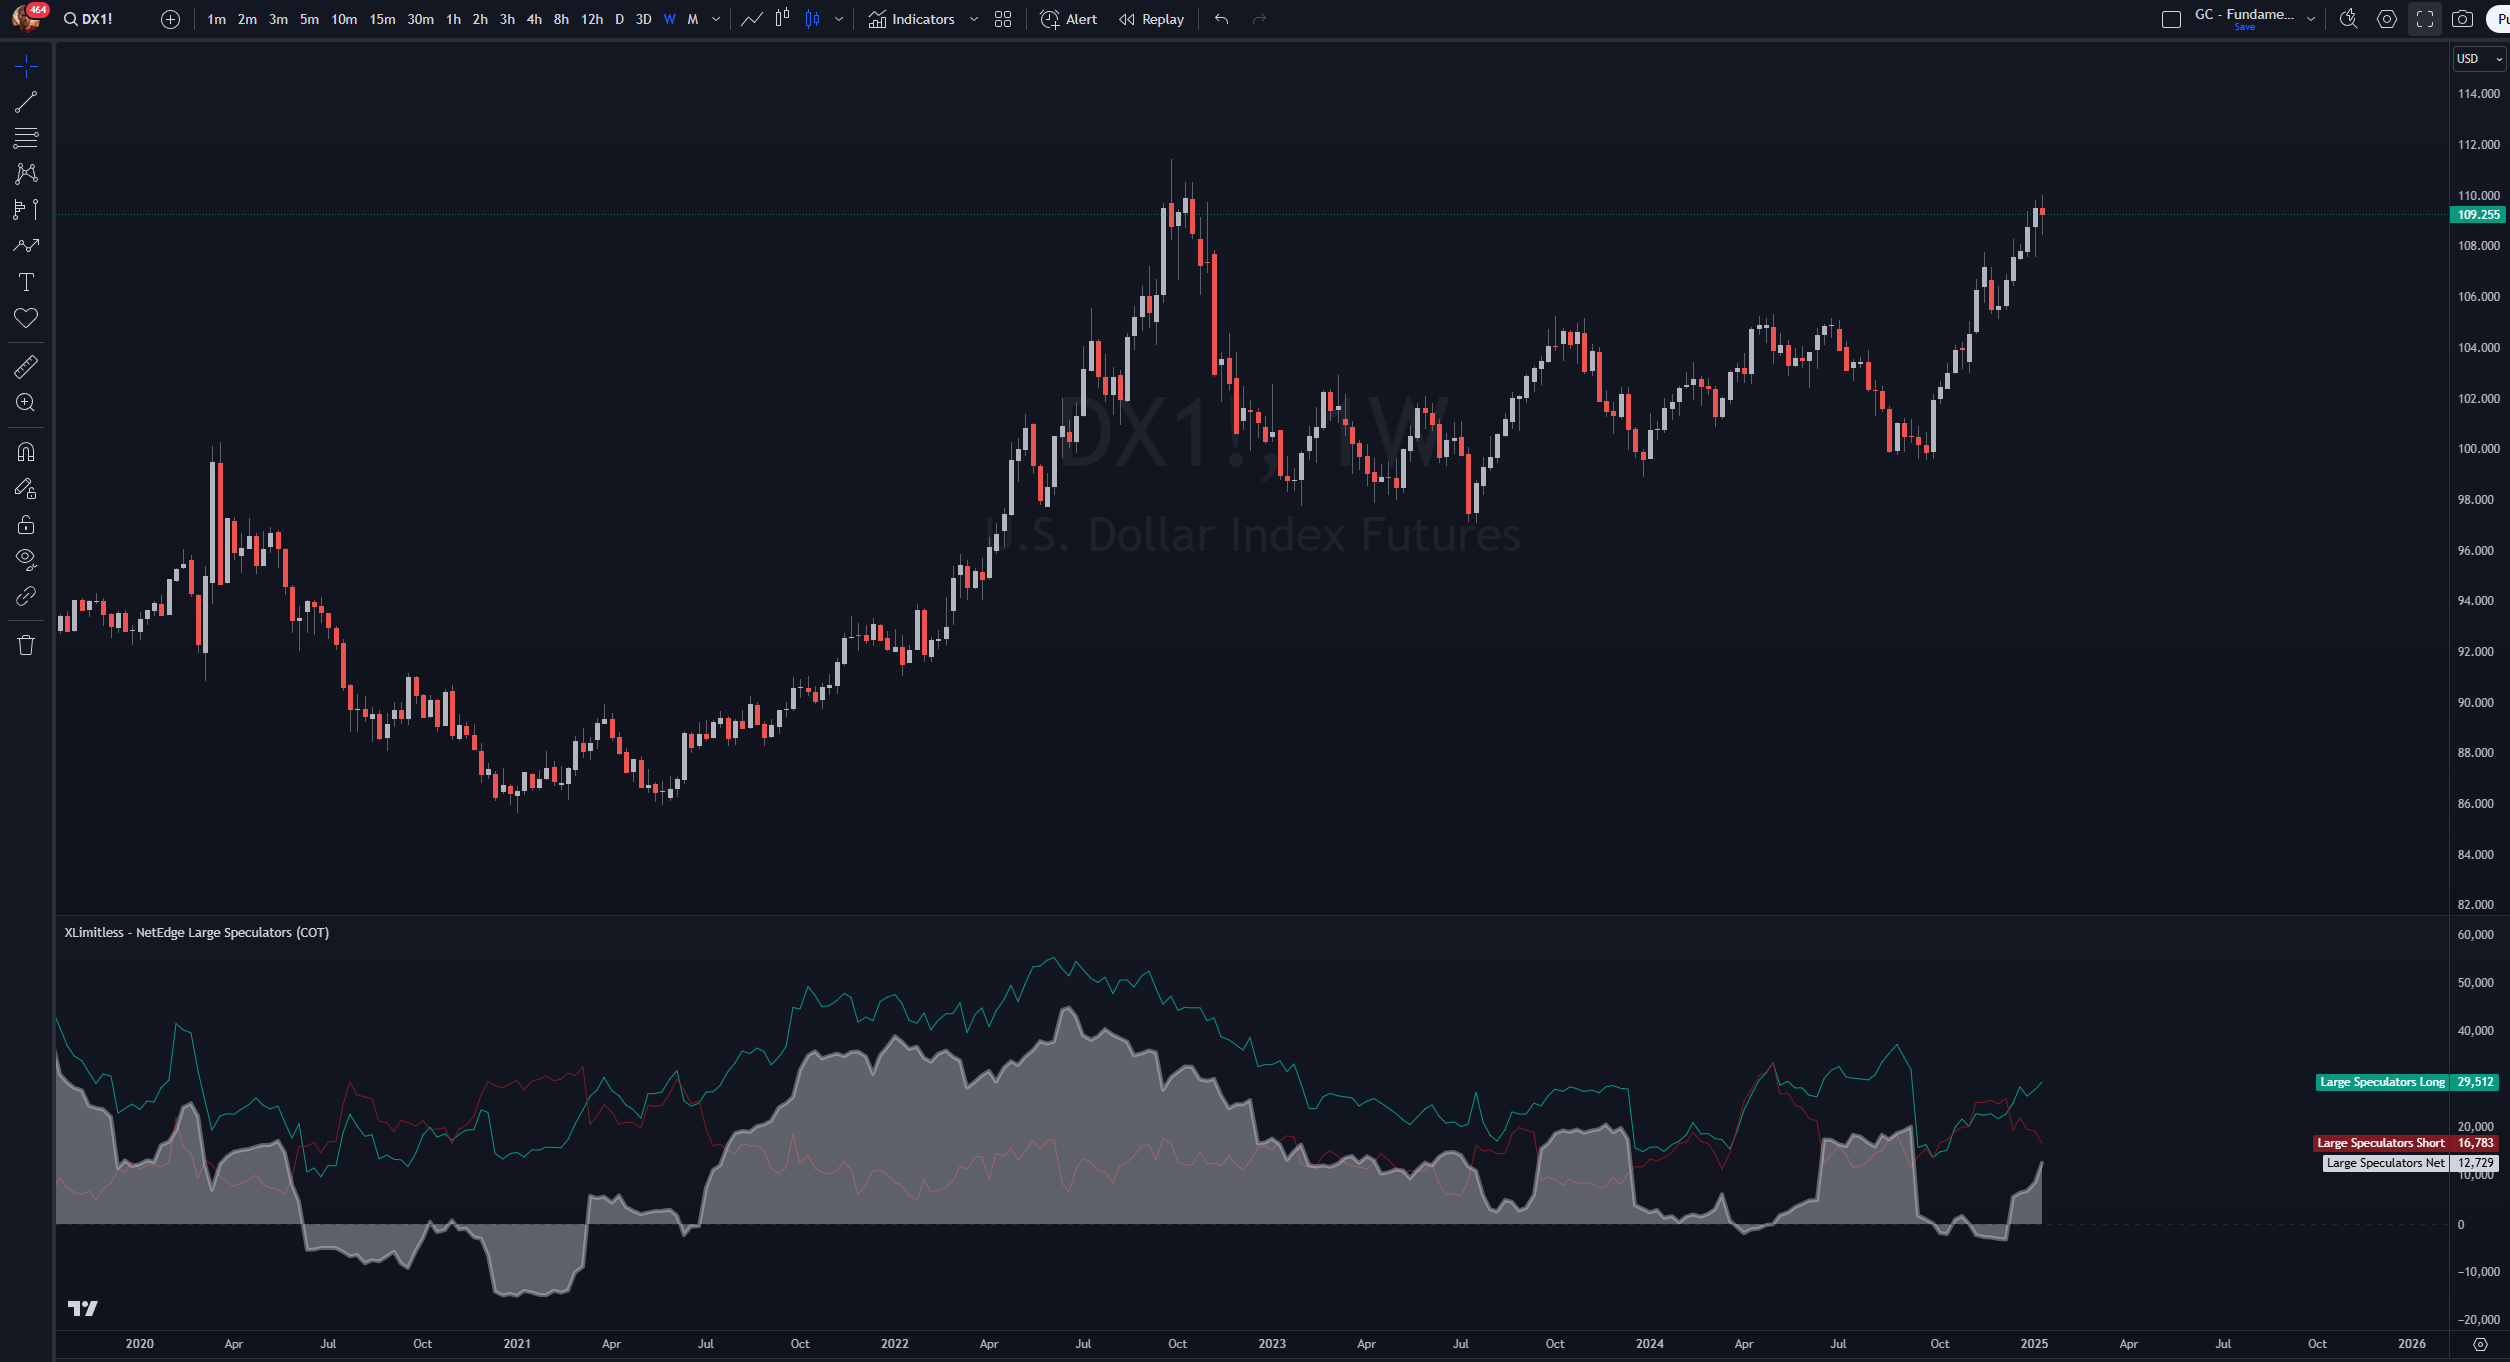
Purpose: Provides insights into the speculative activities of large market participants.

Key features:

  • Displays long positions (green line).
  • Displays short positions (red line).
  • Displays net positions (shaded area in gray).
  • Zero line for reference to indicate net neutrality.

Best use case: Use as a contrarian signal when large speculators reach extreme positions.

3. X Limitless - NetEdge Commercials (COT)

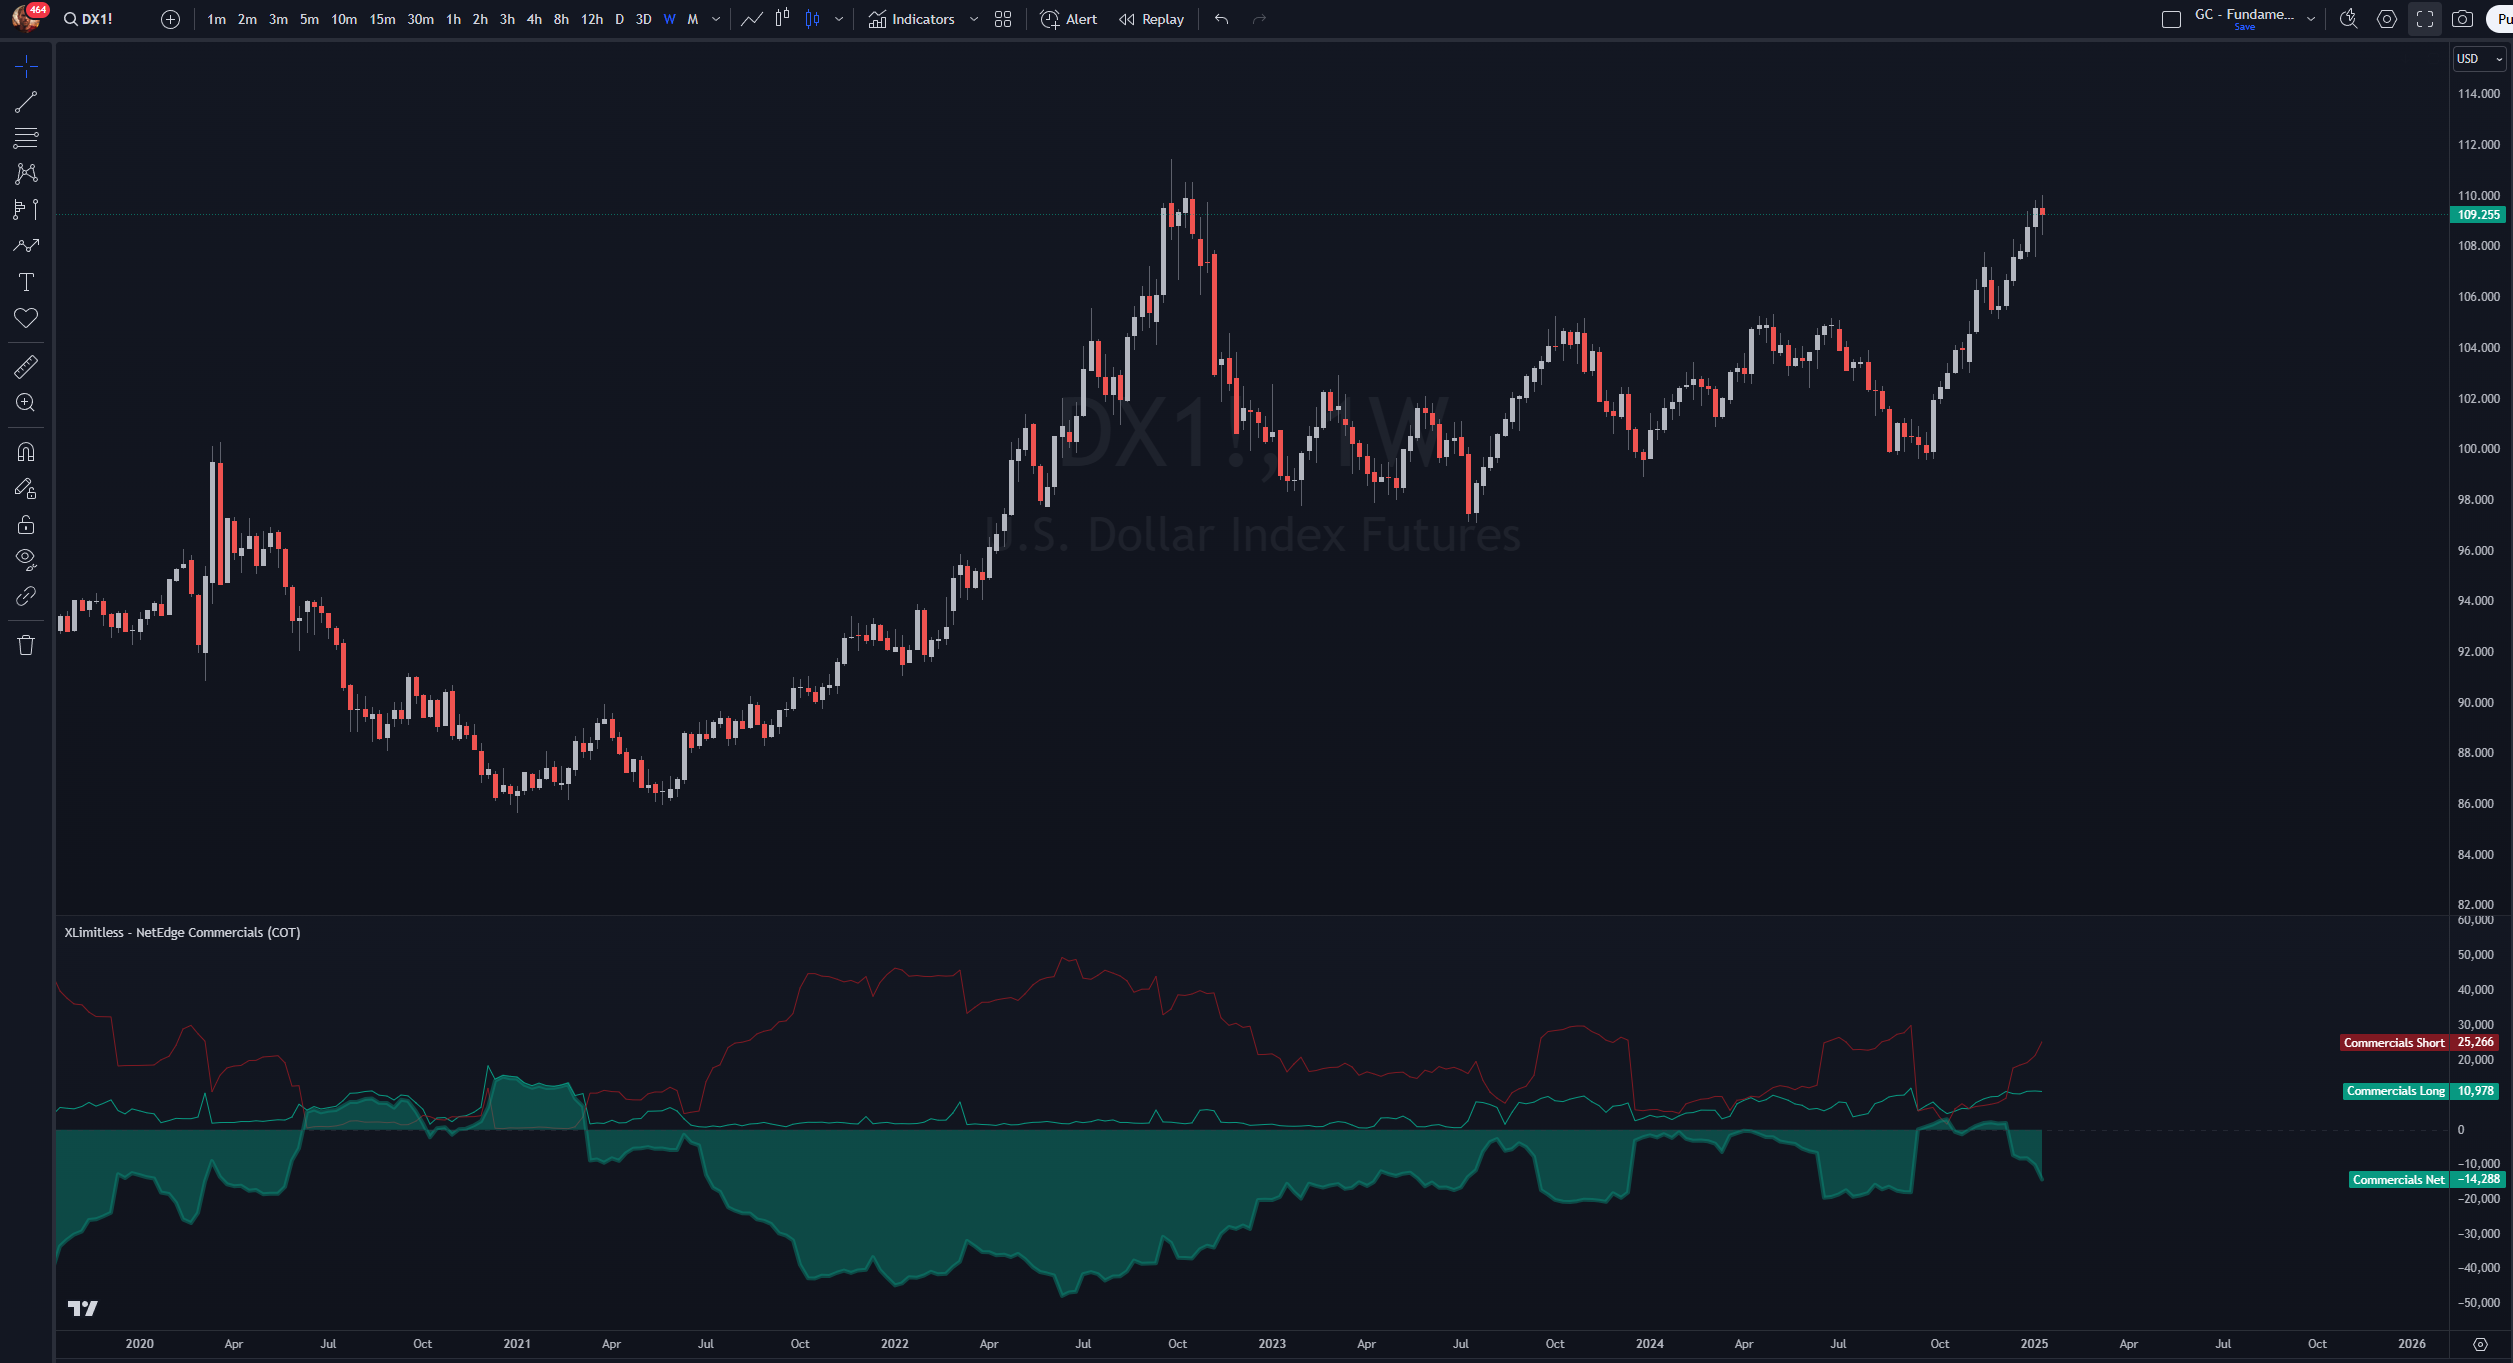
Purpose: Tracks the hedging activities of Commercials, who typically act in the opposite direction of market trends.

Key features:

  • Displays long positions (green line).
  • Displays short positions (red line).
  • Displays net positions (shaded area in green).
  • Zero line for reference to indicate net neutrality.

Best use case: Identify accumulation or distribution phases, as Commercials often signal impending reversals.

Setup Instructions

Adding the Indicator

1. Open TradingView.

2. Navigate to the "Indicators" tab.

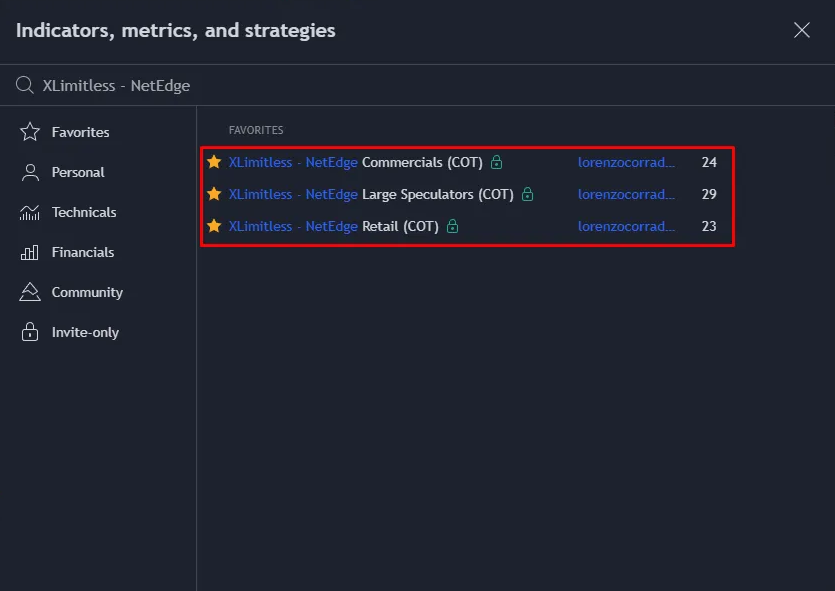
3. Search for the desired “Invite Only” indicator (e.g., XLimitless - NetEdge Retail (COT)) and add it to your chart.

4. Apply the Weekly Timeframe.

Customizing Inputs

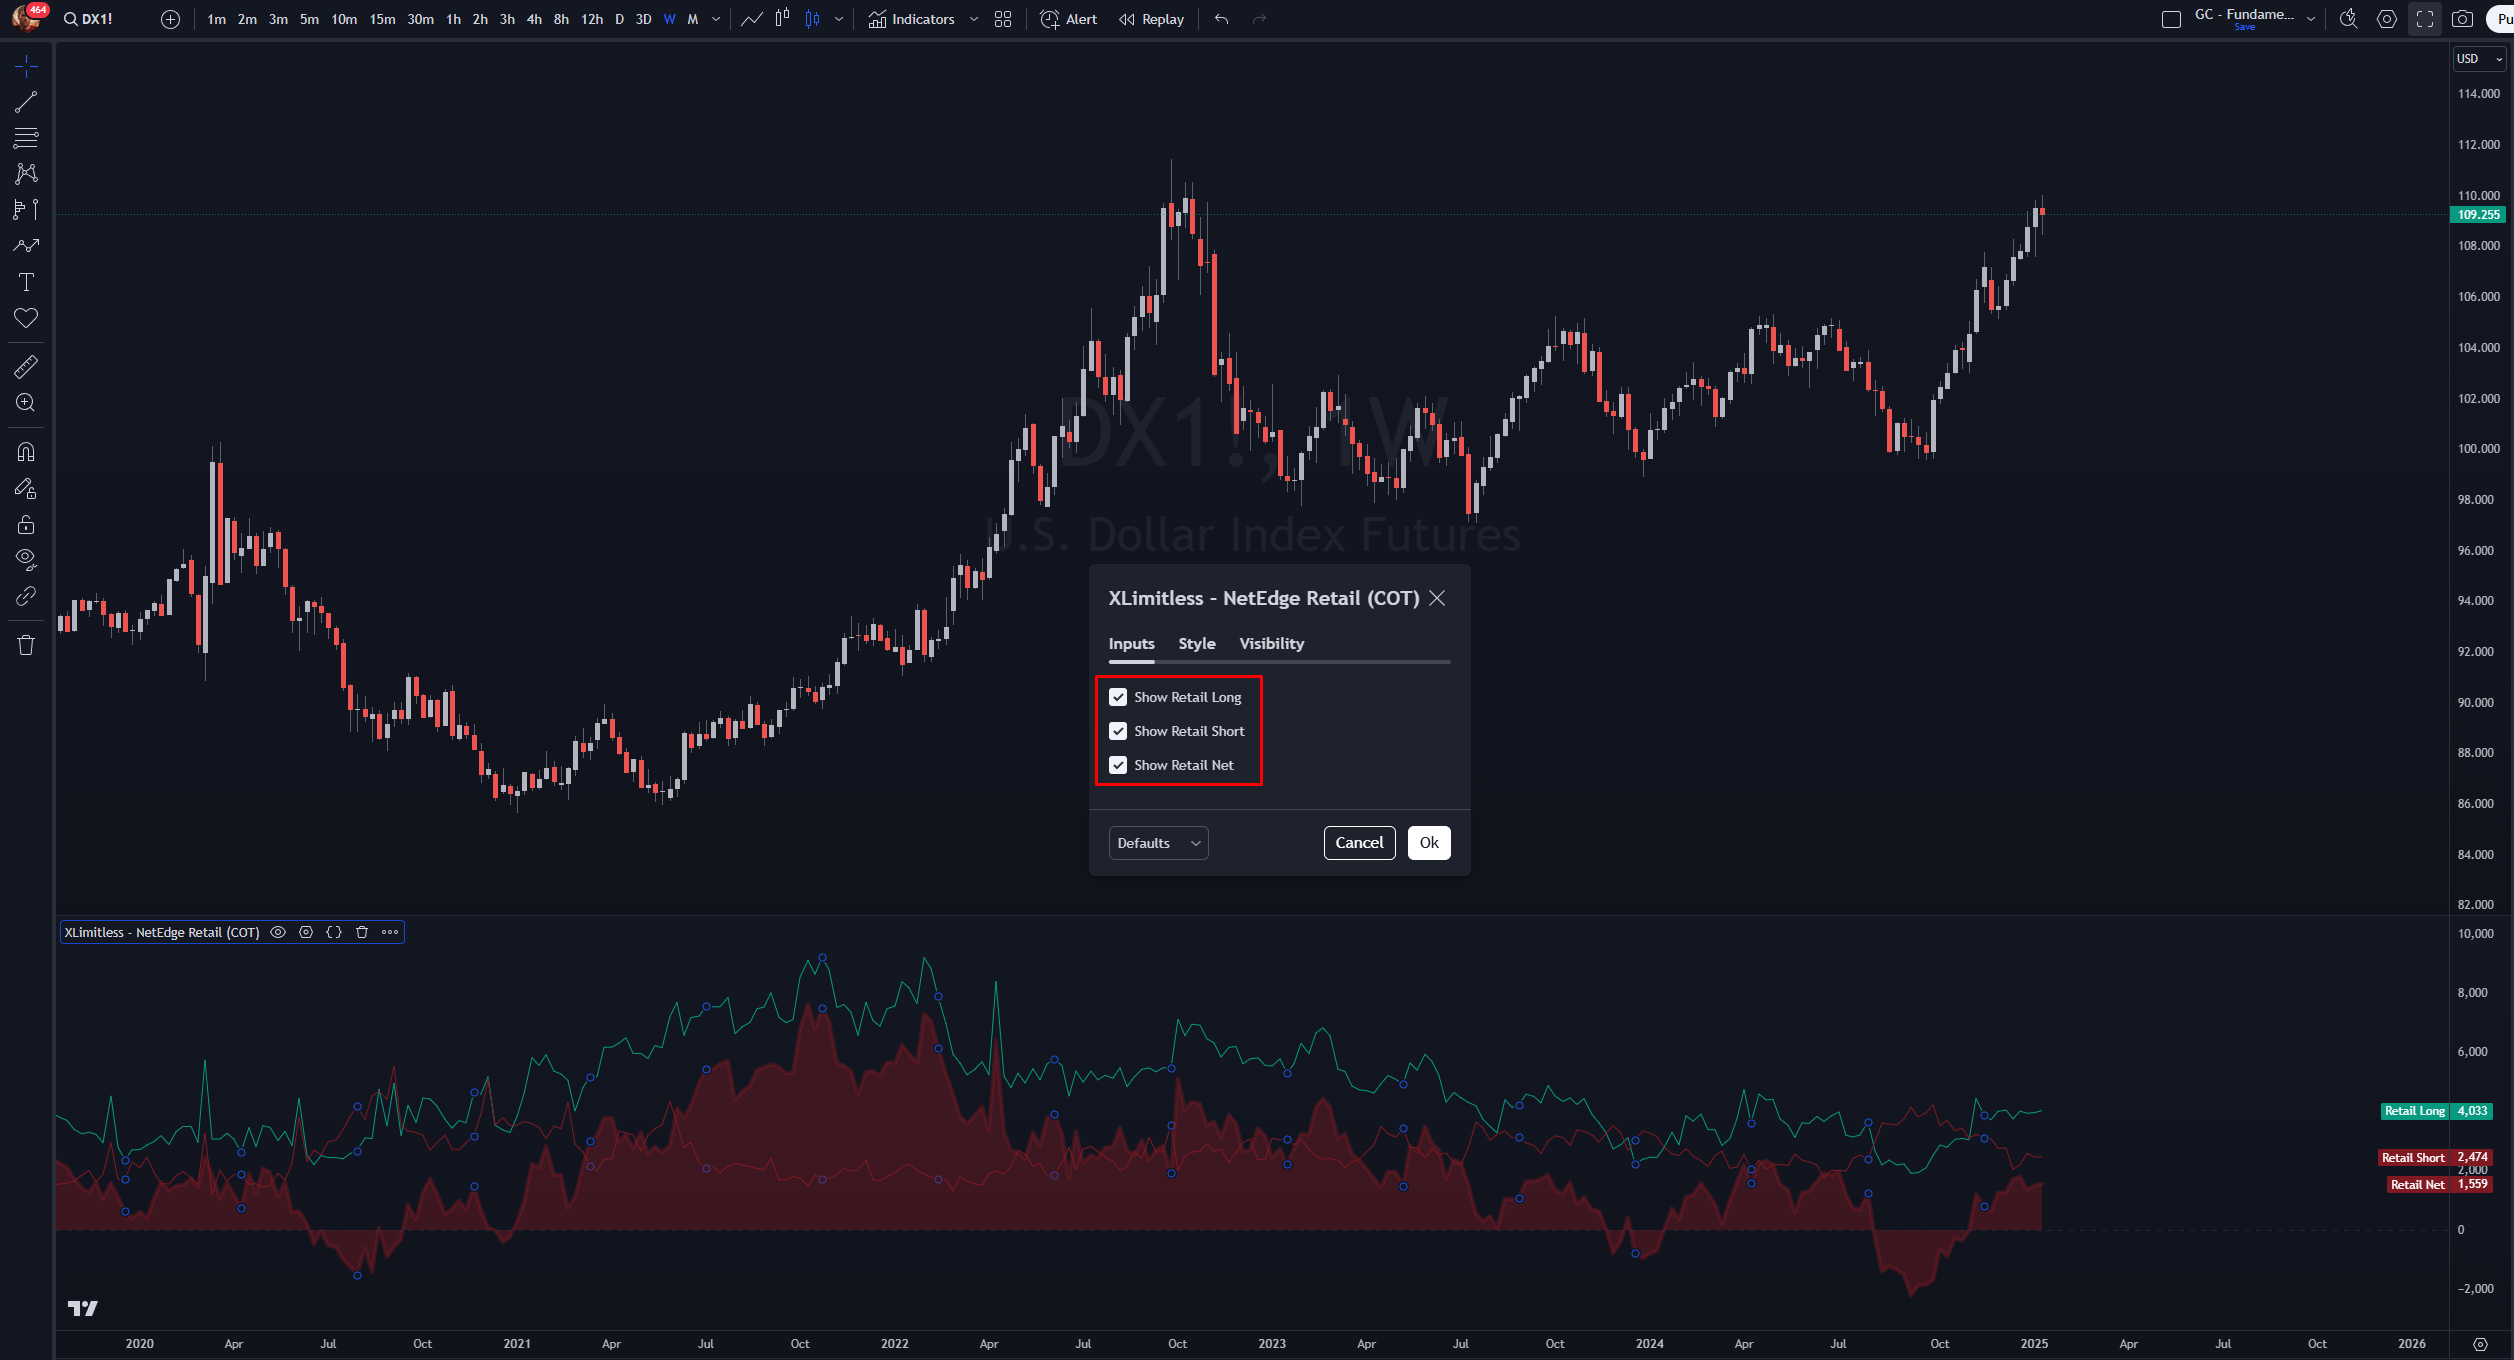
Each indicator includes toggle options for flexibility:

  • Show Long Positions: Enable/disable the green line.
  • Show Short Positions: Enable/disable the red line.
  • Show Net Positions: Enable/disable the shaded area.

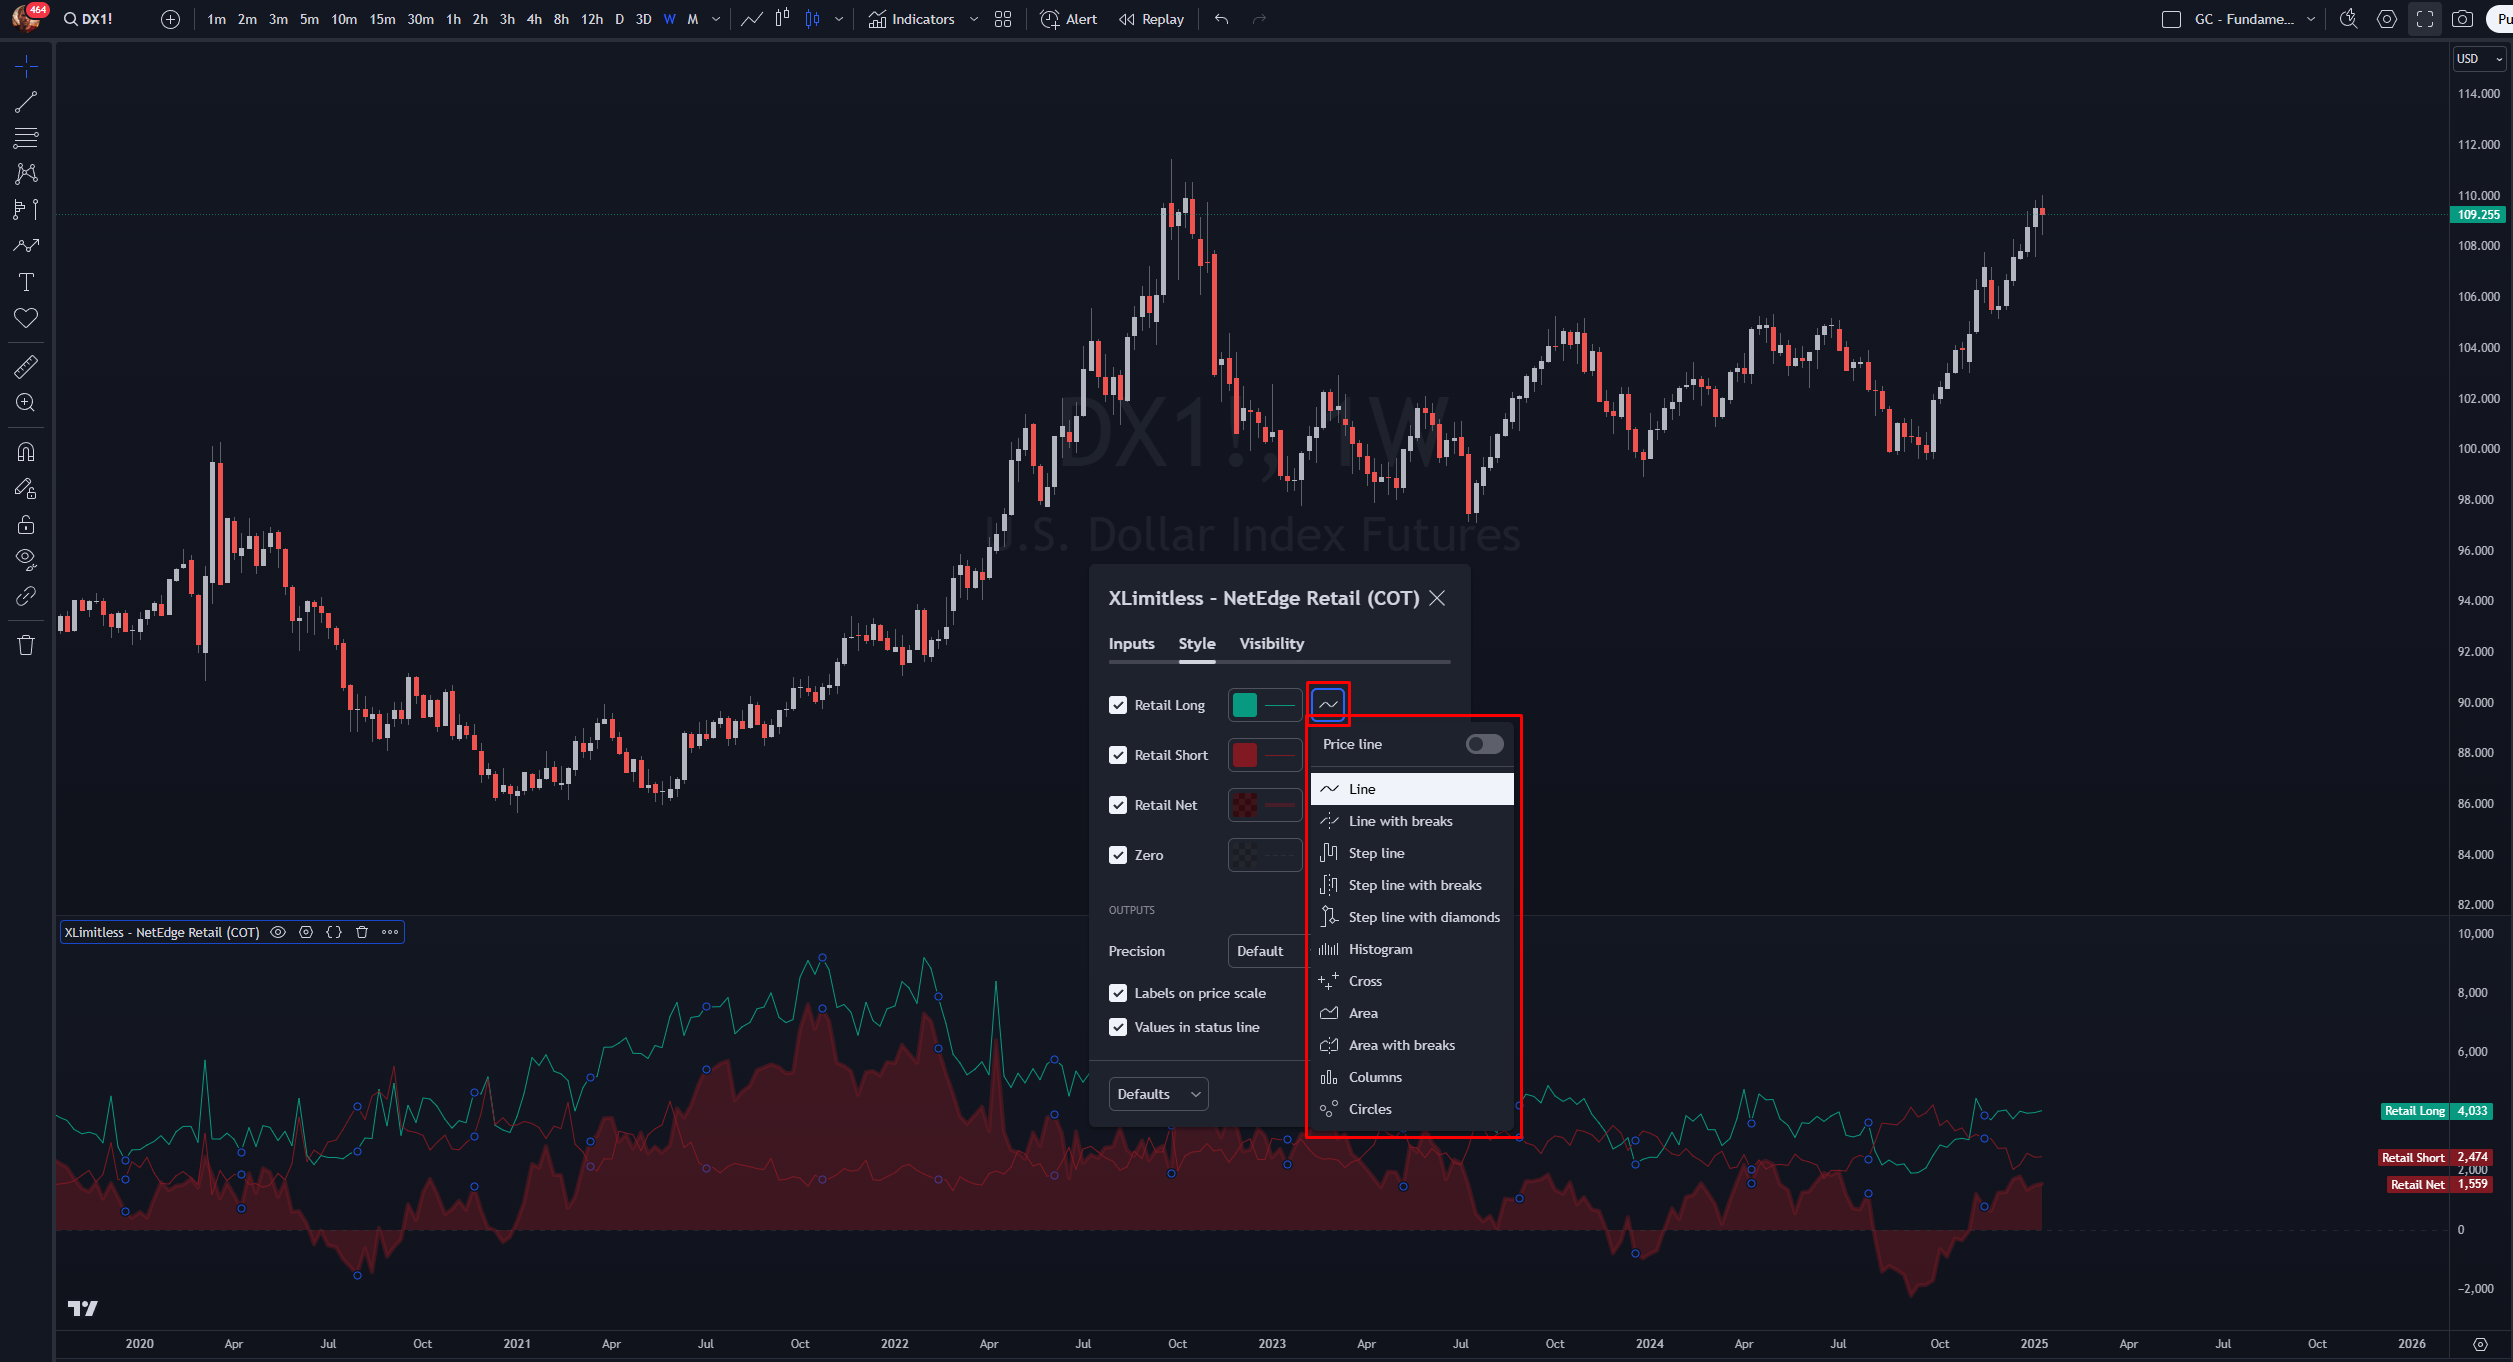
Recommended Style of Each Input:

  • Line Chart: "Best for tracking trends and fluctuations over time."
  • Diagram: "Ideal for visualizing relationships and structures."
  • Area: "Perfect for emphasizing magnitude or cumulative data."

How It Works?

Data Source

The indicators utilize the Commitment of Traders (COT) Legacy reports, accessing data via TradingView’s COT Library. Positions are categorized as follows:

  • Retail Traders (Non-Reportables): Small, non-professional traders.
  • Large Speculators (Non-Commercials): Institutional traders, hedge funds.
  • Commercials (Users & Producers): Businesses that use the asset for production or risk management.

Plotting Mechanics

  1. Long Positions: Total long positions for the participant group.
  2. Short Positions: Total short positions for the participant group.
  3. Net Positions: Calculated as Long – Short.
  4. Zero Line: Indicates neutrality in net positioning.

Quick Note for Plotting Mechanics

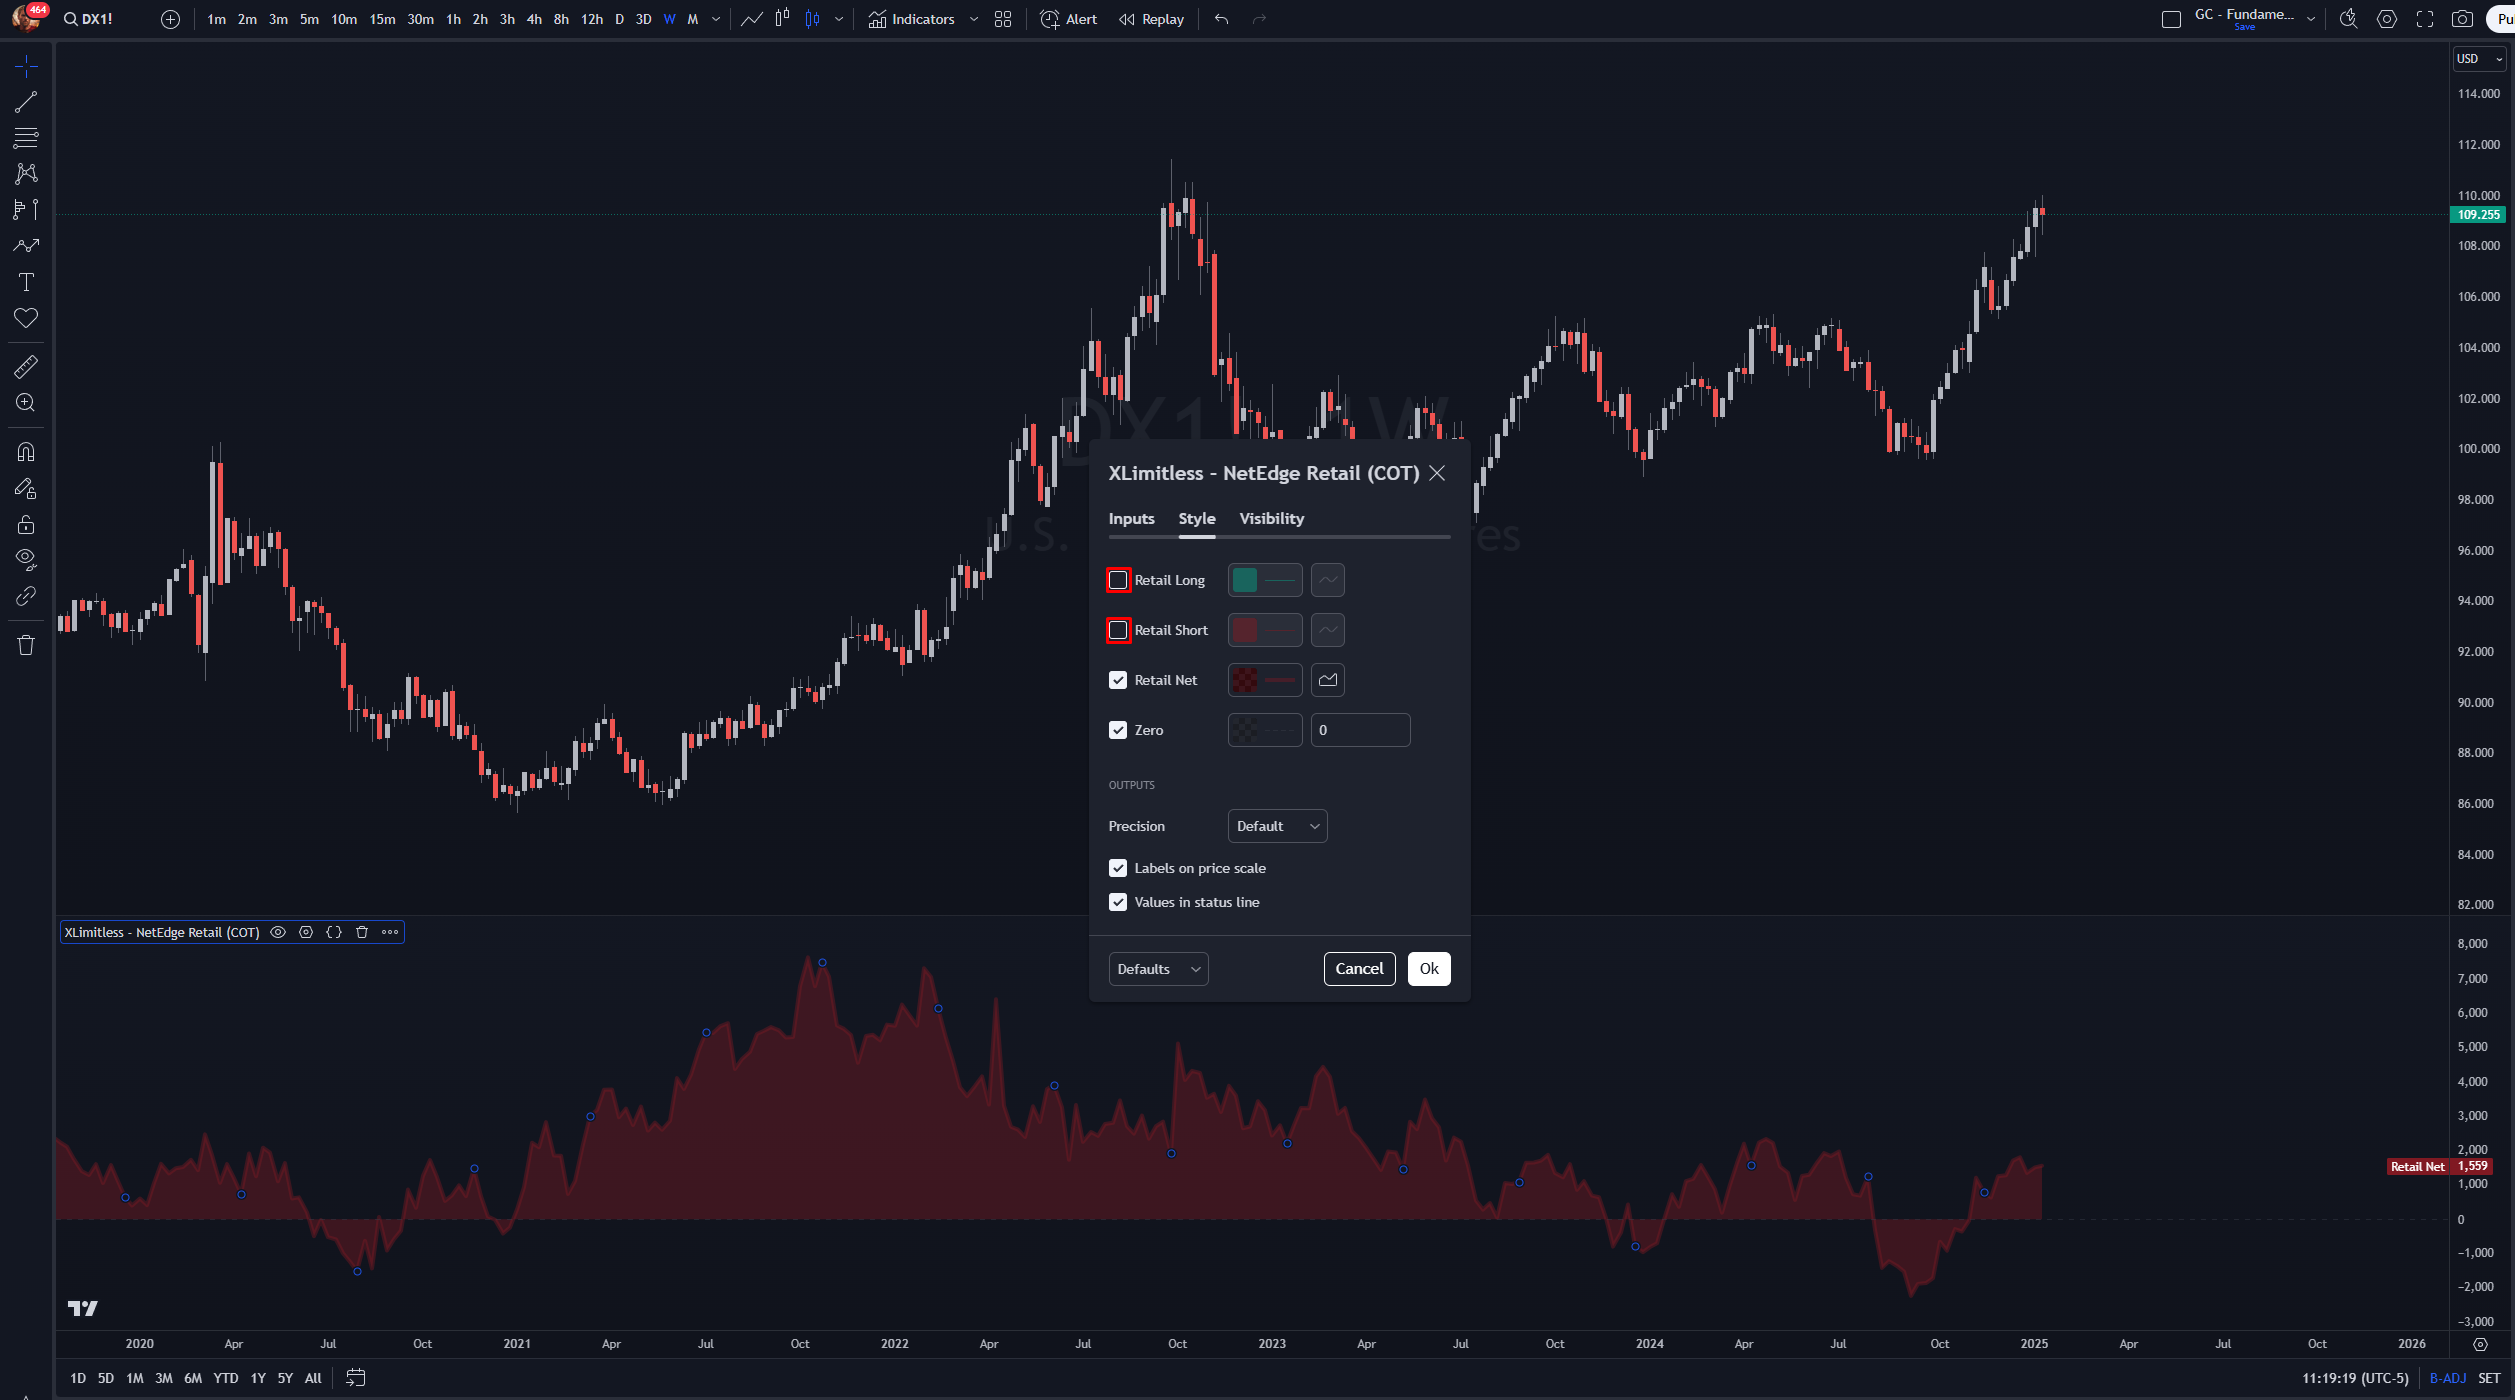
To better analyze the data, it's recommended to separate the Longs, Shorts, and Net Positions while interpreting the charts.

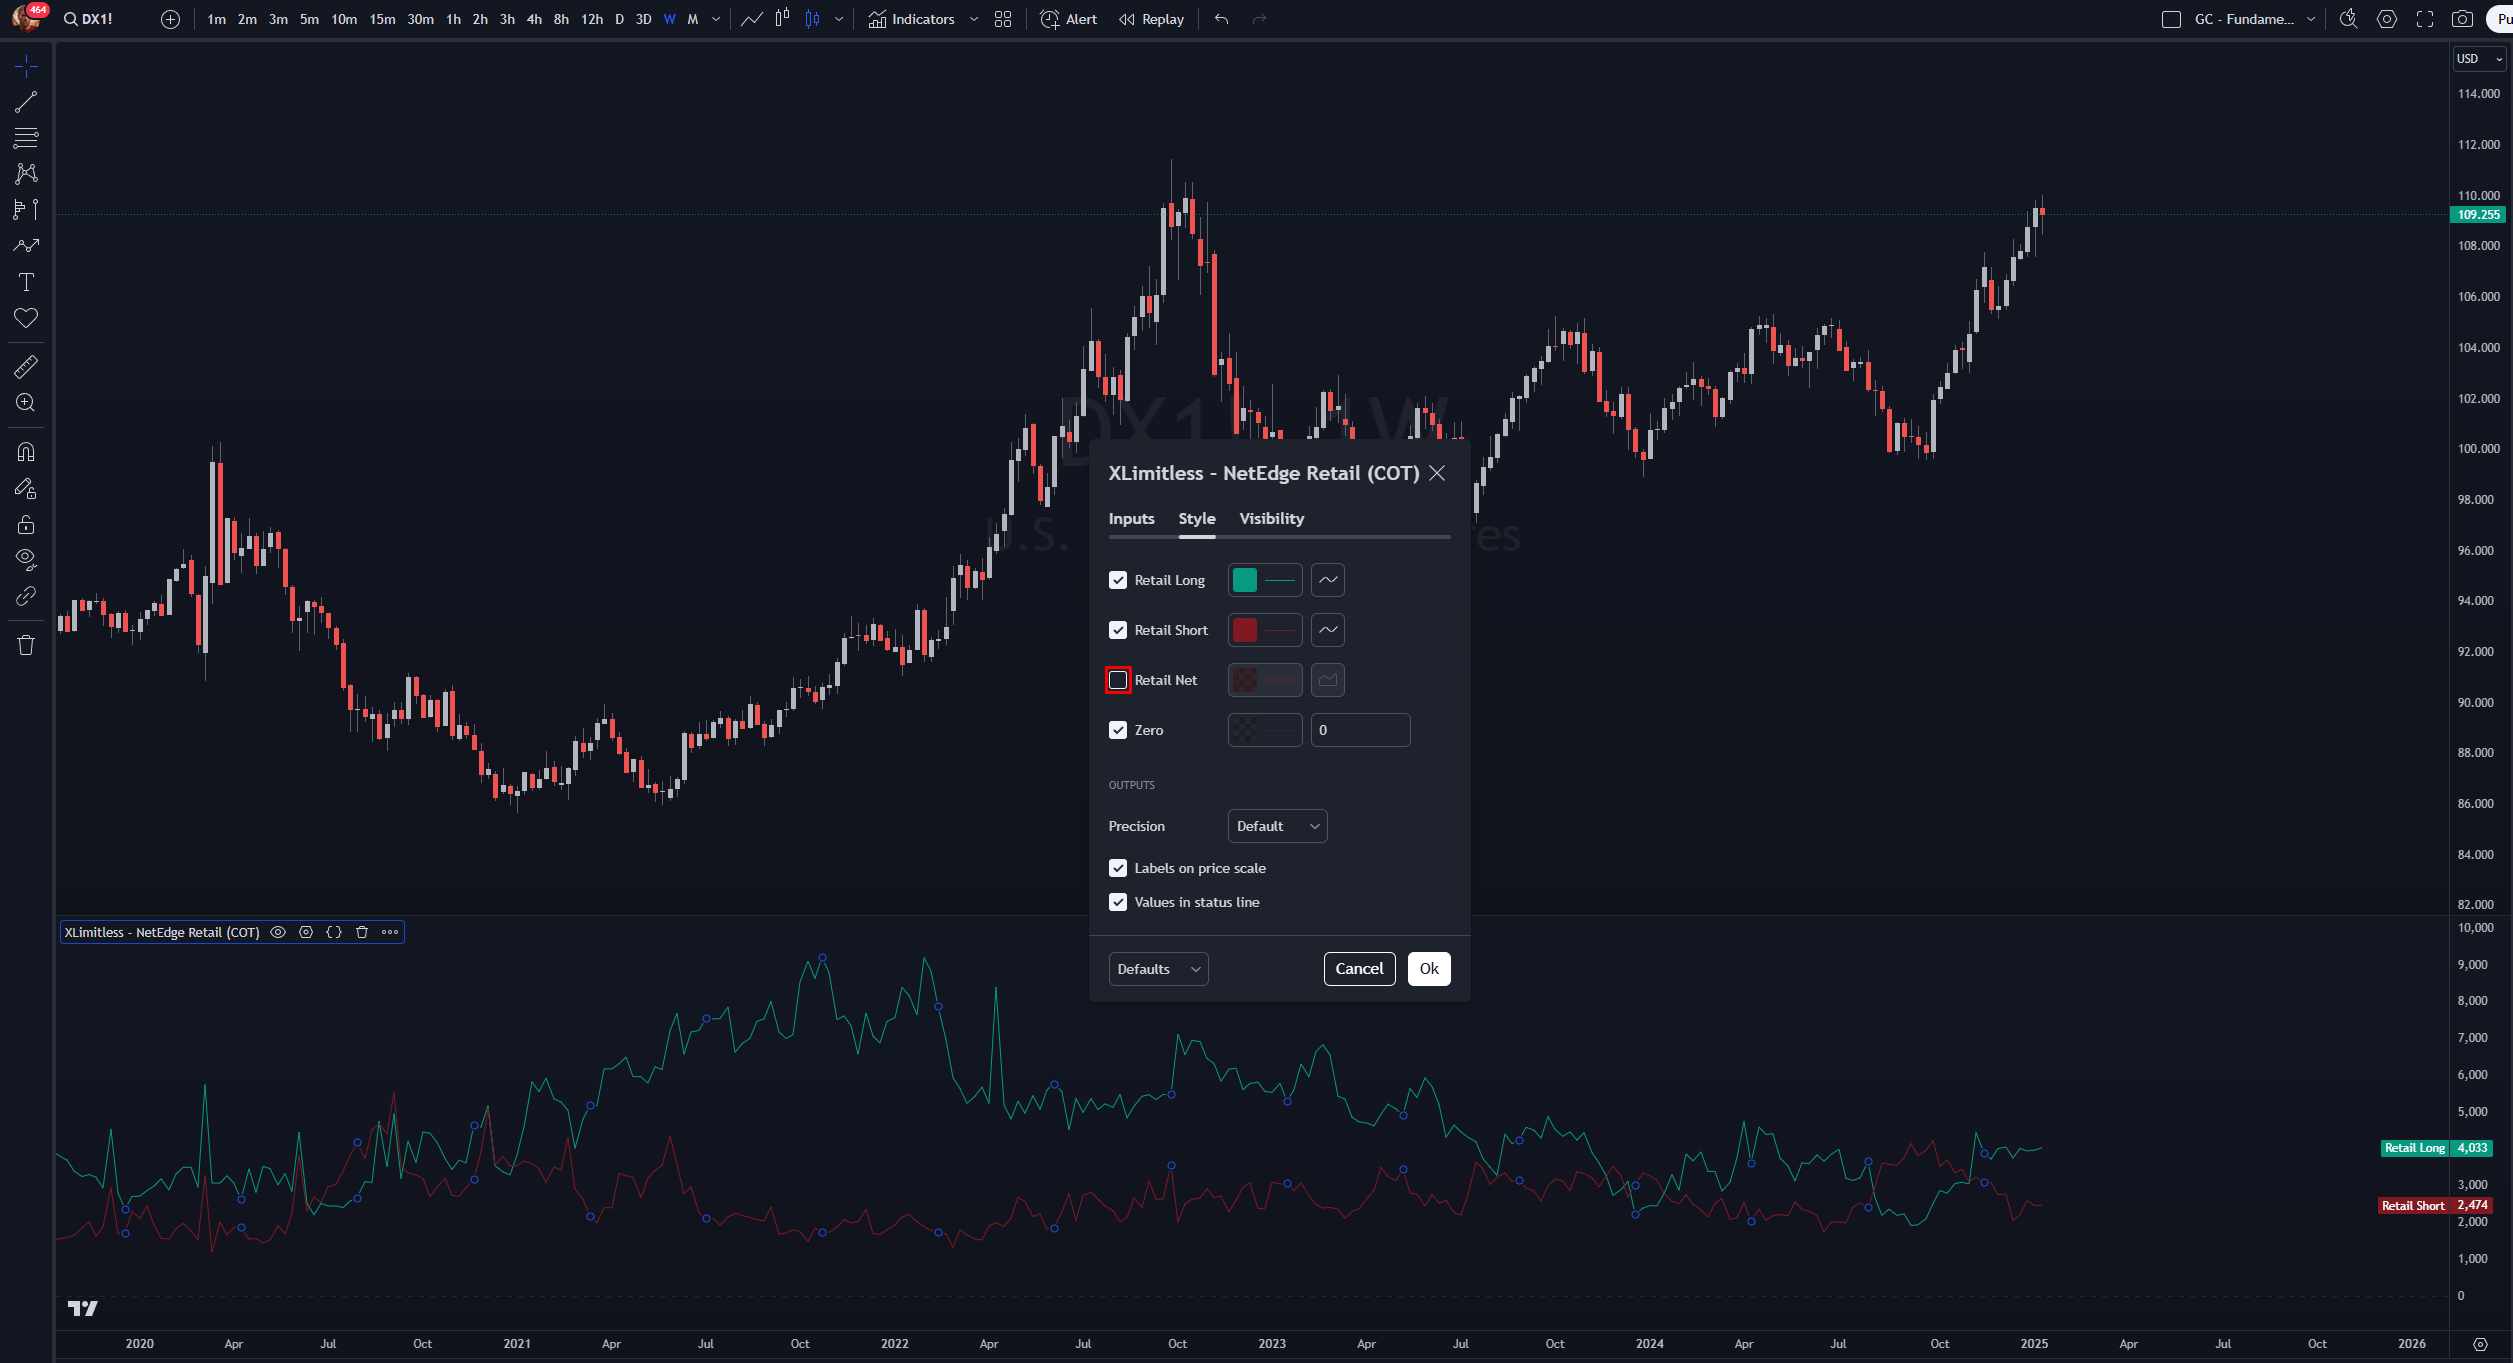
Toggle Off Longs and Shorts: This provides a clearer view of the Net Position, helping to identify trends and market bias more effectively:

Toggle Off Net Positions: Focus solely on Longs and Shorts to understand the underlying positioning dynamics:

Best Practices

Use in Conjunction with Technical Analysis

  • Combine these indicators with support/resistance levels or trend indicators for higher confidence trades.

Purpose:

  1. Understand Positioning Dynamics: The chart visualizes the interplay between long, short, and net positions, providing insights into market sentiment.
  2. Analyze the Bigger Picture: Use the chart to evaluate how net positions fit into broader market cycles rather than interpreting them in isolation.
  3. Focus on Extremes
    • Retail Traders: High net long/short positions may signal potential trend exhaustion.
    • Large Speculators: Overly bullish/bearish positions can serve as contrarian signals.
    • Commercials: Look for accumulation or distribution phases as a precursor to reversals.
  4. Regular Updates
    • Check the data on the weekly timeframe, as COT reports are published every Friday.

Example Use Case

Scenario:

You are analyzing the EUR/USD futures market and want to gauge participant sentiment.
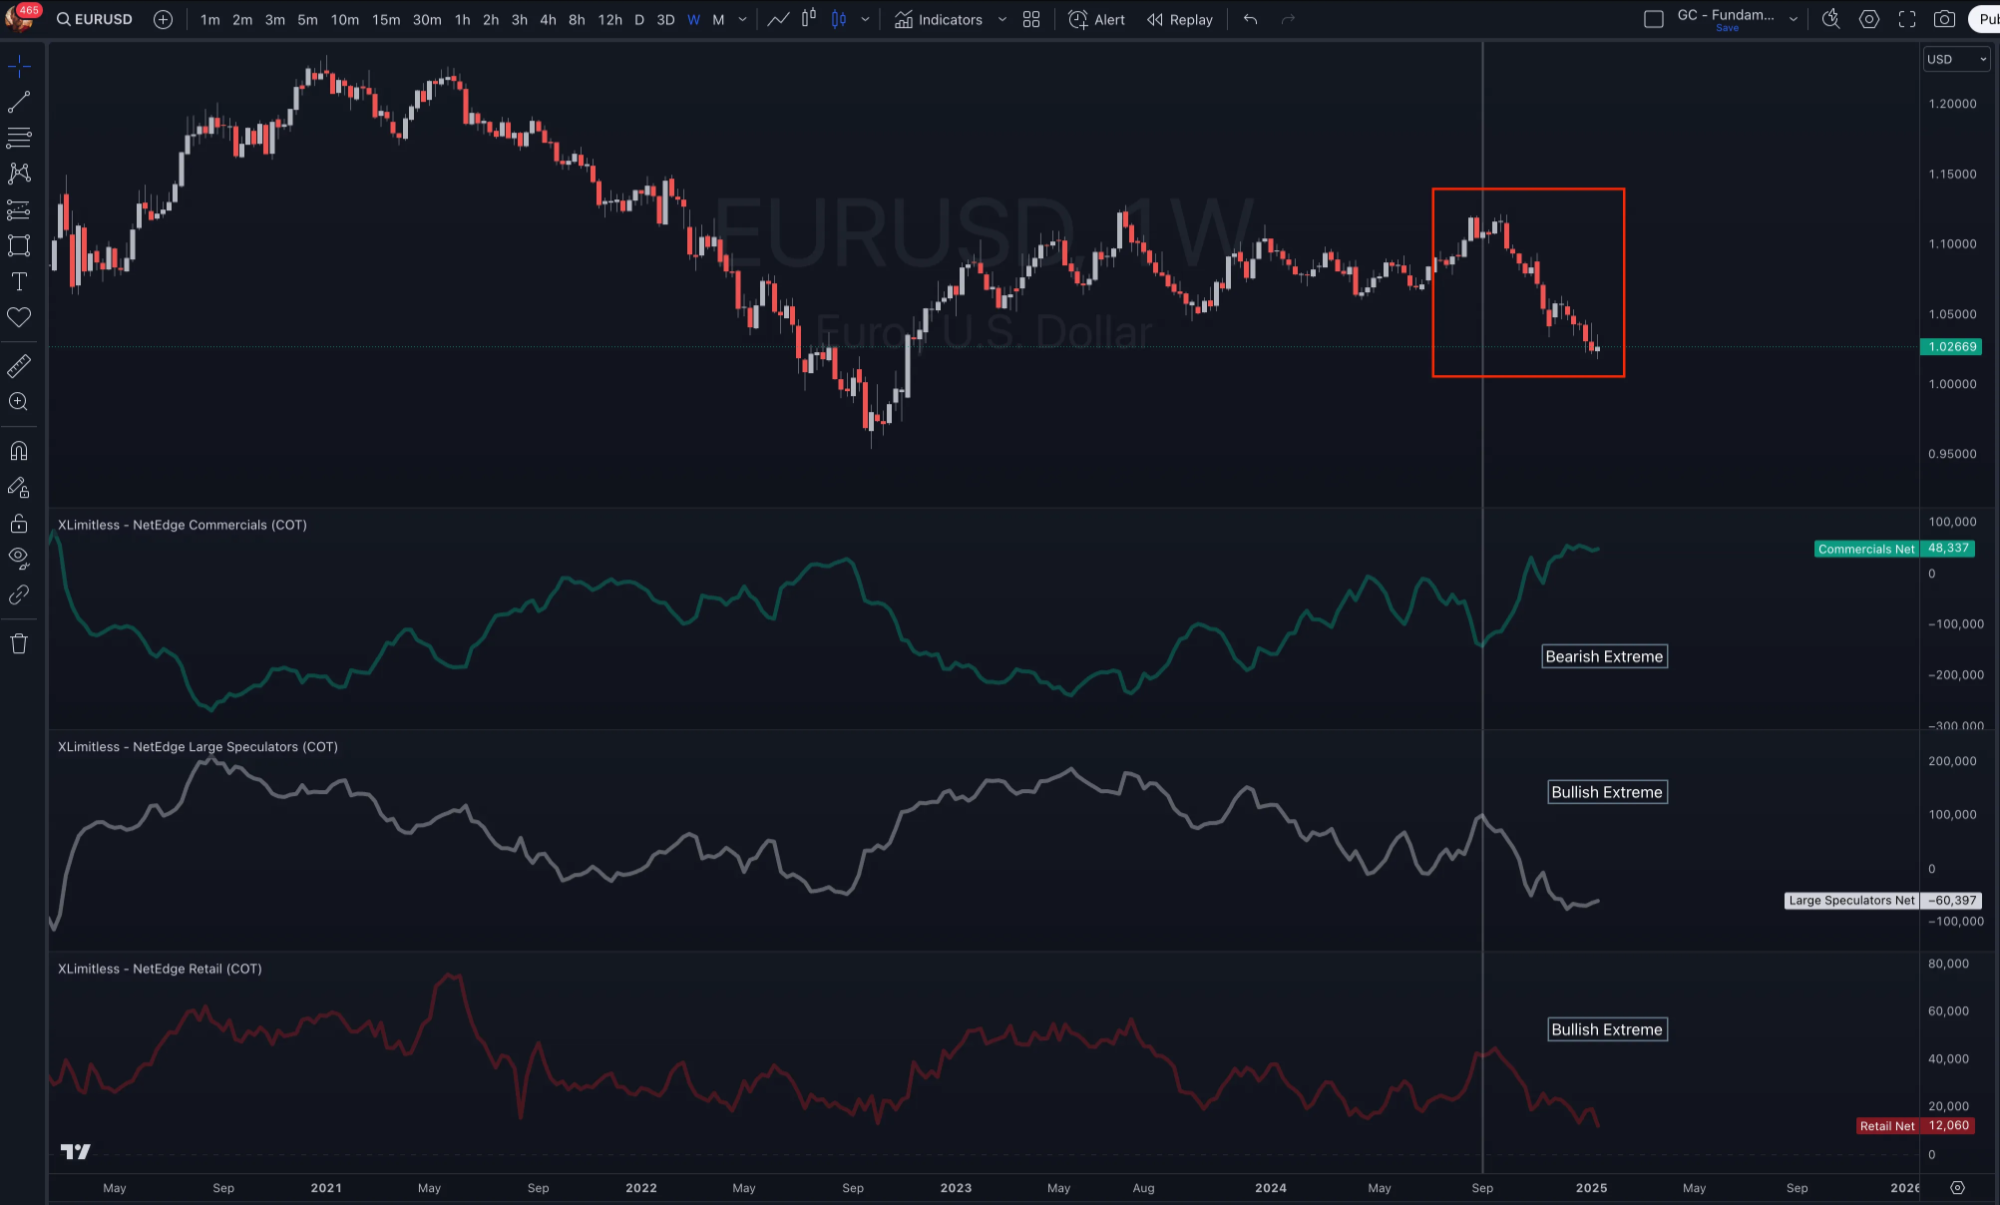
Steps:

  1. Add all three NetEdge indicators to your chart, and style it to your preference.
  2. Observe the net positions:
    • Retail Traders are heavily net long.
    • Large Speculators are net long but nearing their historical extremes.
    • Commercials are net short, indicating potential distribution.
  3. Combine this information with price action and additional confluences.
  4. Conclusion: A reversal to the upside is likely imminent.

FAQs

  1. Why are some plots missing?
    • Ensure the asset you are analyzing has relevant COT data.
  2. How do I interpret the zero line?
    • Positions above zero indicate net long bias, while those below zero indicate net short bias. A positive net position does not necessarily indicate bullish sentiment.

      Instead, it’s essential to compare:

      Is the net position significantly below its historical average?
      Are long or short positions diverging from their usual behavior?
      How does the current position align with historical extremes?
  3. Can these indicators be used for equities?
    • No, they are specifically designed for assets with COT data (futures and commodities).

Disclaimer

The Net Edge is designed to gauge market sentiment, making it a valuable tool for additional confluence. However, it is not intended to serve as a timing tool.

Trading involves substantial risk and is not suitable for all investors. Always perform your own due diligence before making financial decisions.